Working with automated QA projects
Annotation projects with automated quality assurance (QA) are projects in which you create and automate annotations for various kinds of data, to be used in machine learning applications.
Automated QA means that labels will be reviewed automatically. This method uses an existing manual QA project to create a 'benchmark' to automatically review labels created by annotators. The manual QA 'benchmark project needs to be complete, and use the same ontology you selected for your automated QA project. Click here for more information on automated QA projects.
We are rolling this feature out into open availability in Beta mode. While it's already powerful and flexible enough to solve many problems, we're still working to improve this feature to handle all the various use-cases that may arise. Don't hesitate to reach out to product@encord.com if you encounter any issues while using the Automated QA functionality, or have ideas about how to can be improved. All feedback will be appreciated!
Roles and permissions
| Permission | Admin | Team Manager | Annotator |
|---|---|---|---|
| Attach / Detach datasets | X | ||
| Attach / Switch ontology | X | ||
| Benchmark QA | X | ||
| Delete | X | ||
| Invite team members | X | X | |
| Manage team permissions | X | ||
| Manage admins | X | ||
| Annotate tasks in the task management system | X | X | X |
| Control assignments & status in the task management system | X | X | |
| View your team's performance | X | X |
Project dashboard
Clicking on a project in the 'Projects overview' screen takes you to its 'Project dashboard'.
This is where you monitor and manage your project. For example, you can view your project's summary statistics, manage labeling tasks, view your team's productivity, train models and invite collaborators.
The dashboard is split into 7 tabs:
- Summary: a high-level view of labeling and productivity statistics.
- Explore: a quick way to explore the distribution of instances and labels across data assets in the project.
- Labels: for managing all the project's labeling activity and tasks.
- Performance: a more detailed view of your team's manual labeling and productivity.
- Models: for creating, training and using pre-trained computer vision models with your labeled training data.
- Export: for exporting your labeling data.
- Settings: editing project options, ontology, team collaborators, and other general project settings.
Summary
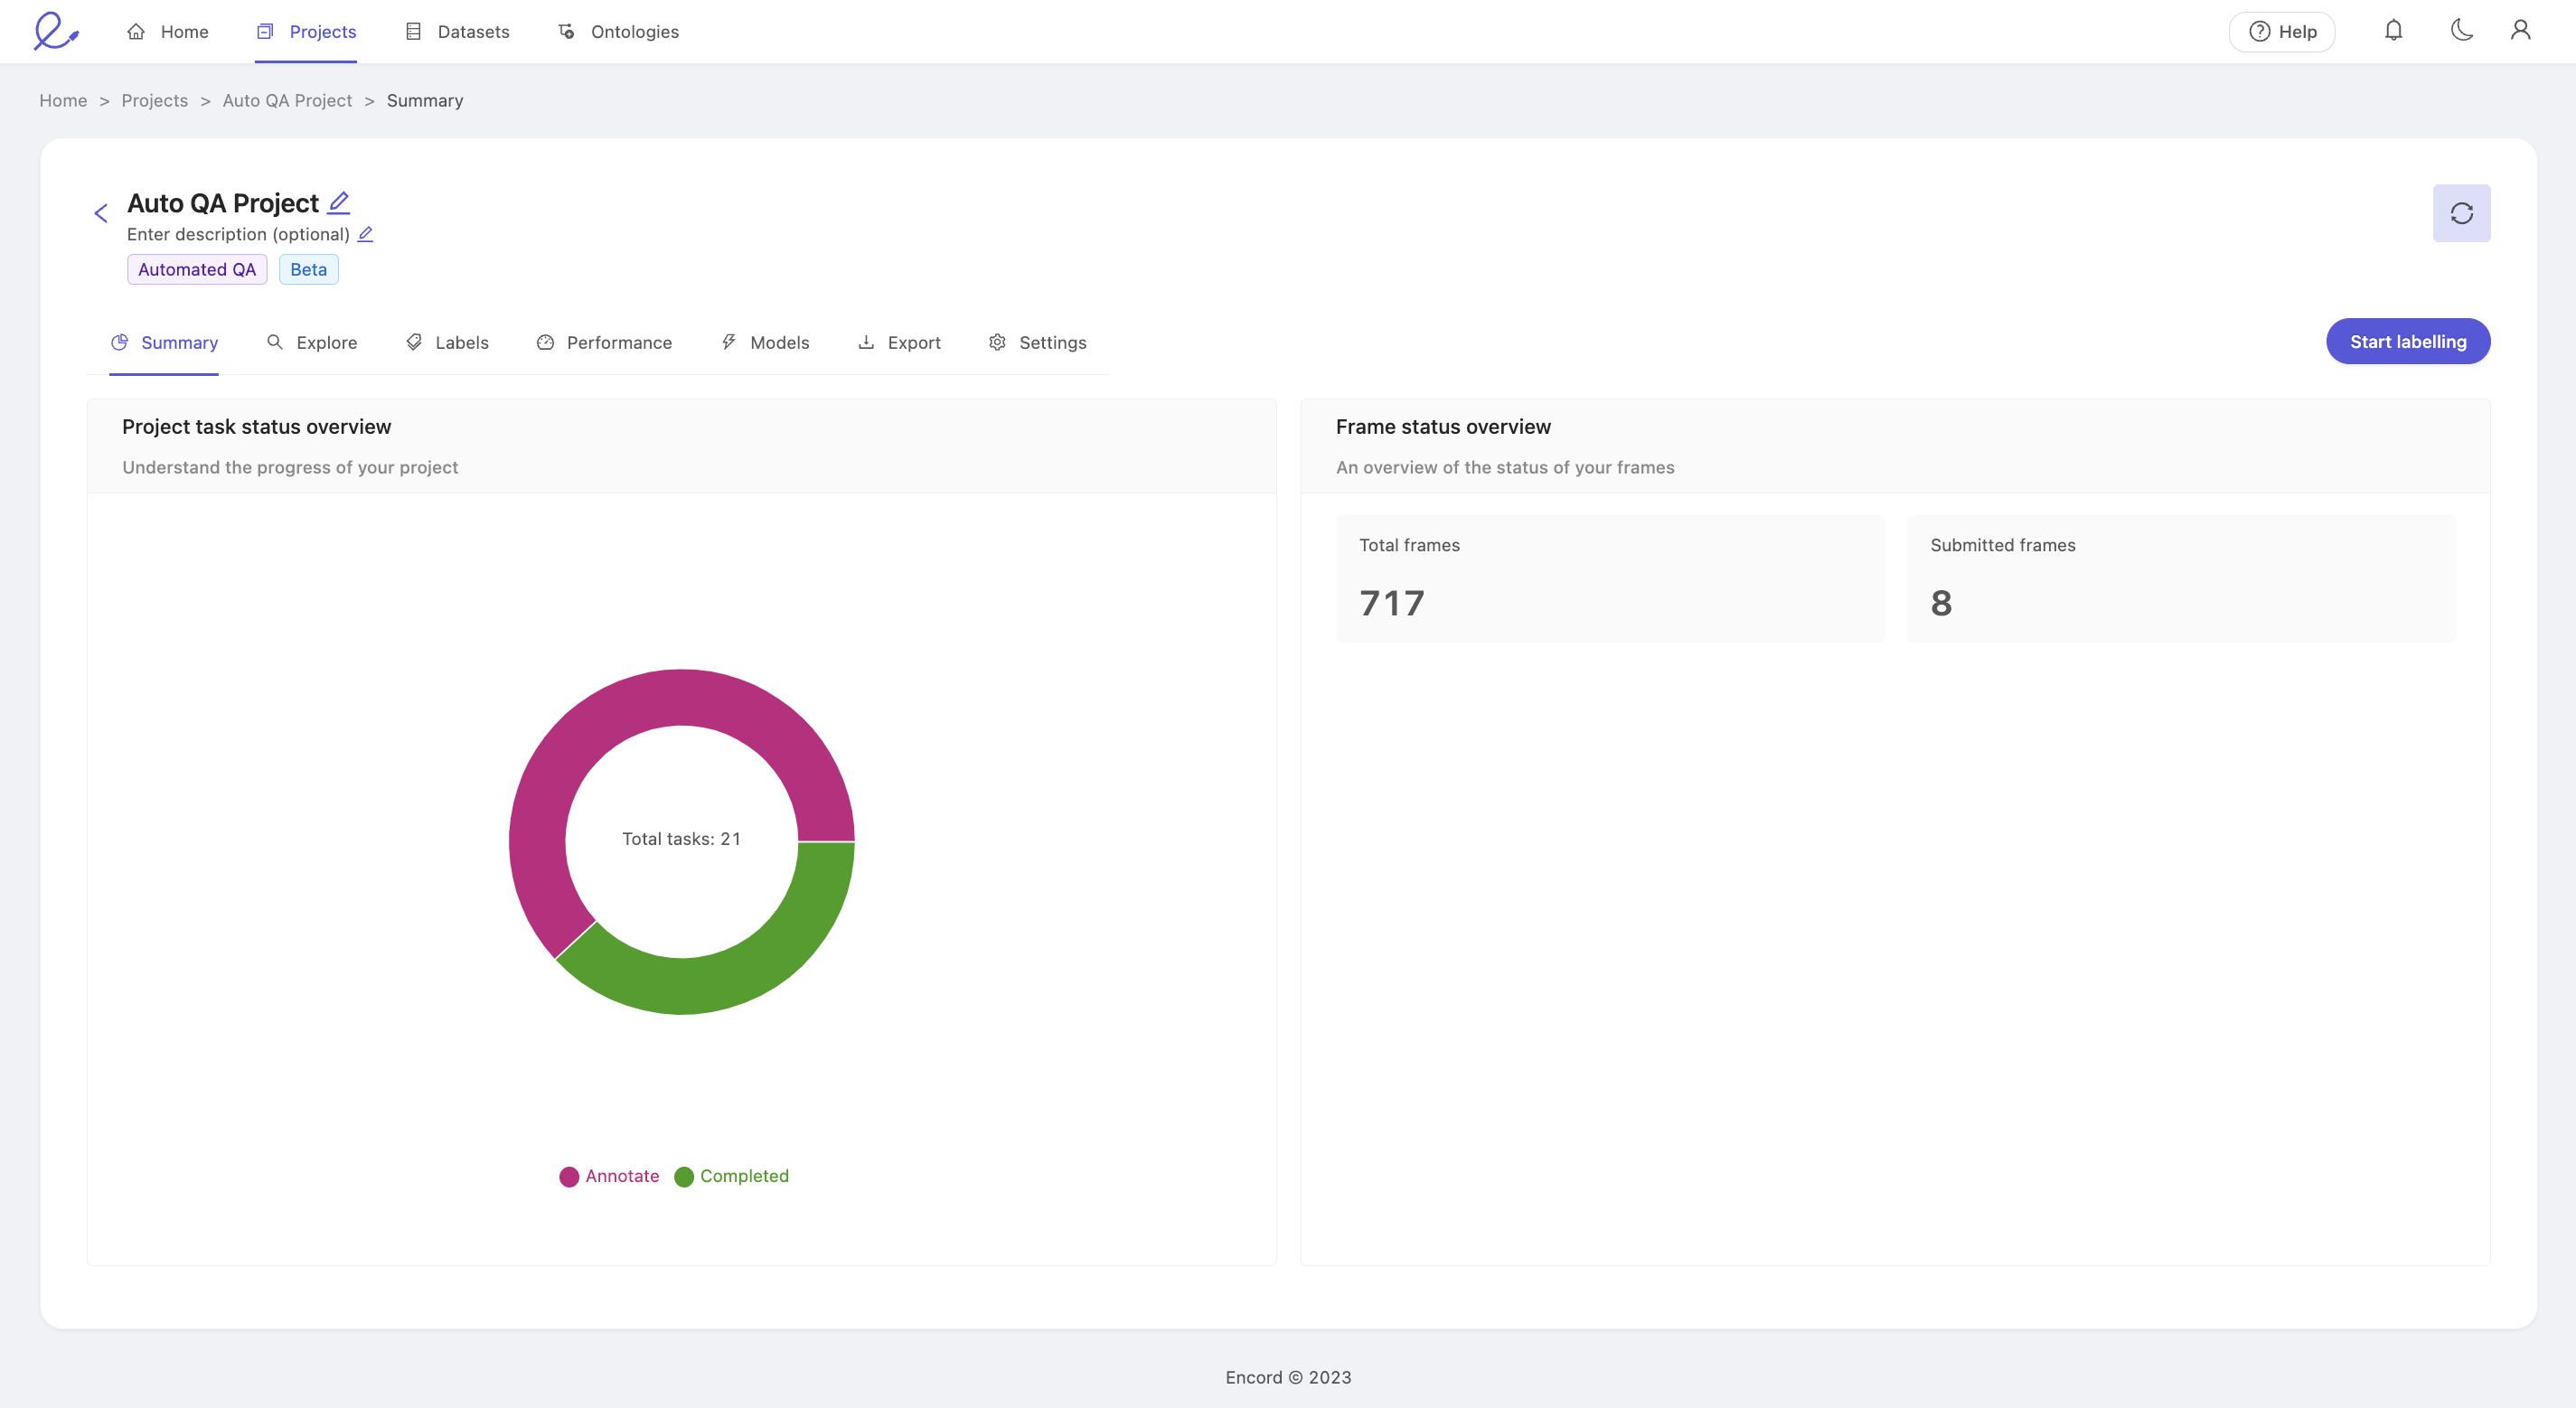
Clicking an annotation project takes you to its summary dashboard. This dashboard has 2 components and gives you a rich visual display of your project's progress at a high level.
'Project task status overview' displays the number of annotation tasks that are in either the Annotate, or Completed state.
- Annotate: The task is ready to be annotated.
- Completed: The task has been annotated, and automatically reviewed. There is no further action to be taken.
Explore
The 'Explore' tab provides interfaces to help you understand how project's annotations are distributed amongst the data assets at both an instance and label level. It allows a deeper exploration through nested classifications on objects, as well as frame-level classifications.
- Instance statistics: Class distribution across data assets in the given project.
- Label statistics: Label distributions within data assets, objects and classifications.
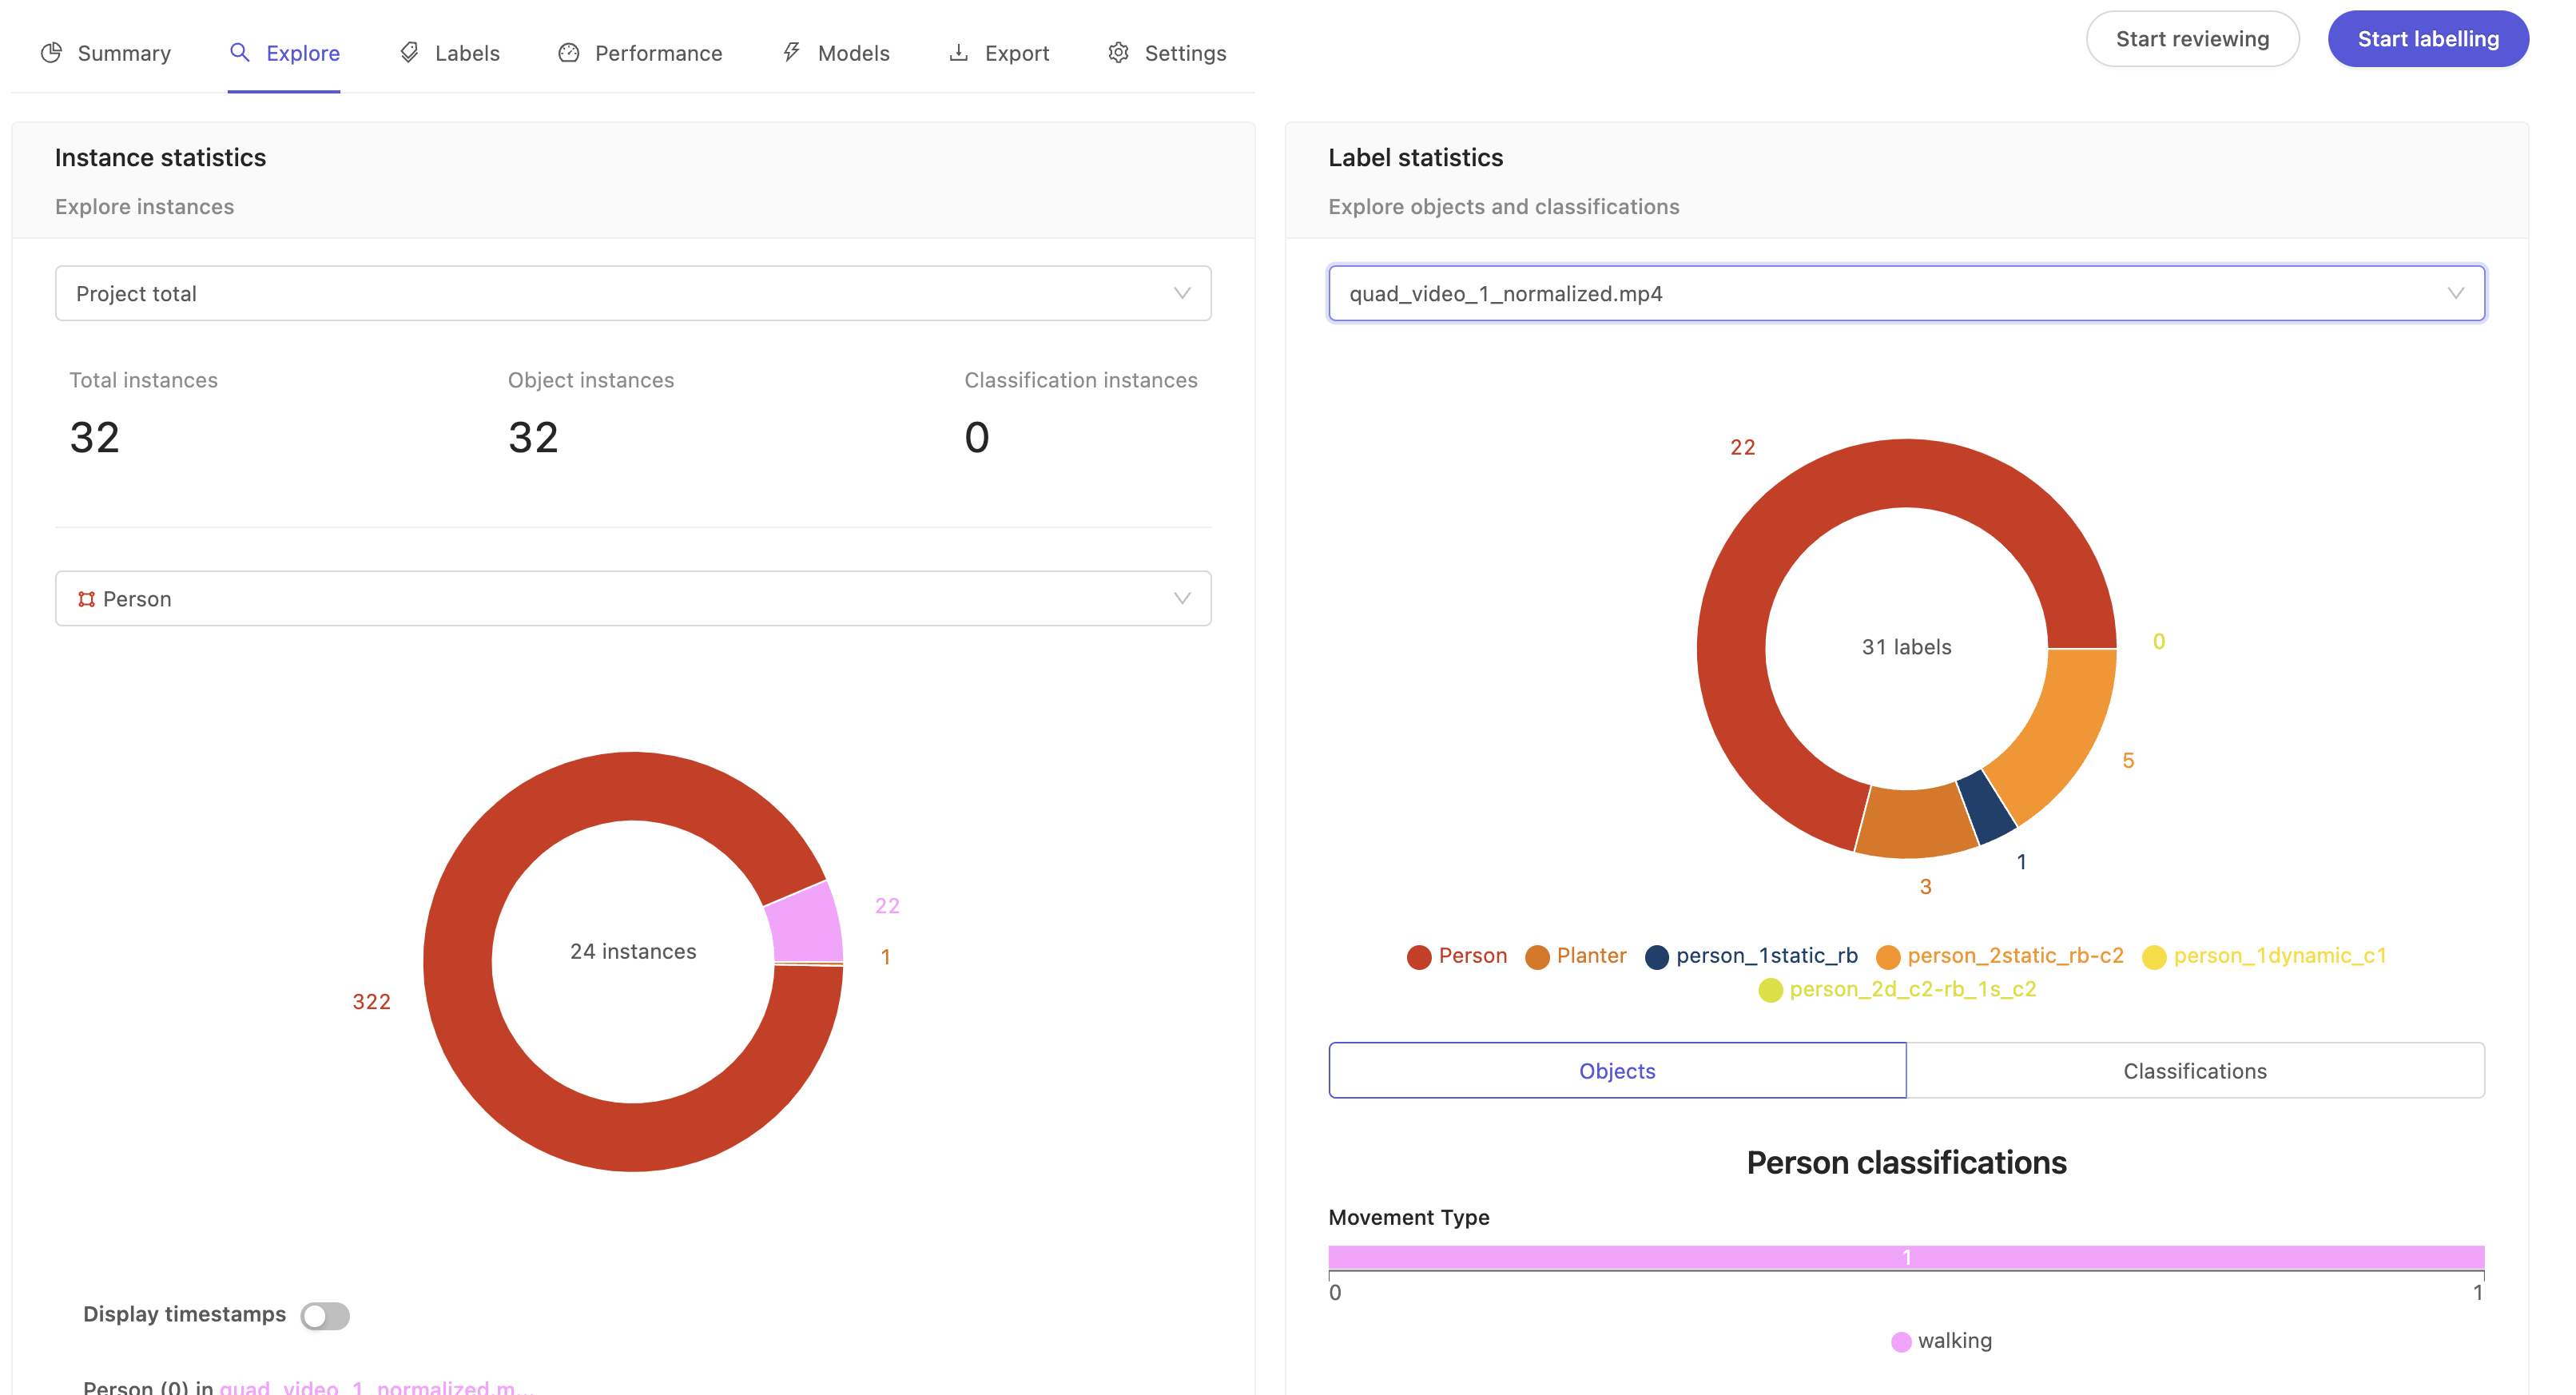
Instance statistics
This section provides the total count of all instances across the datasets in your project.
- Project total: Shows total instances (both objects and classifications) across the project by default. To get instance statistics for individual data files, click the dropdown to select a data file.
- Select class: Shows the total instances for a particular class. This is a summary of how a given class is distributed across your project's data assets. The pie chart segments show a breakdown of how that class is split across the data assets.
- Display timestamps: Flip the toggle to switch between frame numbers and timestamps for the labels.
Label statistics
This is a summary of how your labels are distributed across the project. The pie chart shows a breakdown of how many labels there are for a given class.
- Project total: Shows the total number of labels across different datasets in the project. To get label stats for individual data files, click the dropdown to select a data file.
- Objects: Click on the pie chart segment of a class to see the total number of labels and its nested classifications (sometimes called nested attributes) if available for that class.
- Classifications: Shows the global classification at project or individual video level. For example, location, time of day, etc.
Quick definitions of classes, instances and labels
- Class: Fundamental unit of the project's ontology. For example the ontology of a project annotating traffic videos could have classes such as Car, Truck, Bicycle, and so on. For more information on objects and classifications, see Ontologies Overview.
- Instance: Specific occurrence of a class. Car(0) is an instance of the Car class, for example, it could be a specific black sedan. The single Car(0) instance can appear in a single frame or a range of frames. Therefore, instances may contain multiple labels across frames.
- Label: An frame-specific annotation of an instance. For example the annotation of Car(0) on frame 201 is a label.
Labels
The labels page is your gateway to annotating and auditing the labels made against all the datasets in your project.
Access to each pane will depend on the user's project role. We quickly summarize the purpose of each tab, and the roles which can access each below.
The labels dashboard features the following tabs:
- Activity: View all Completed tasks, and confirm the status of the labels within those tasks by clicking View.
- Queue: The Queue tab is where all labeling is initiated, regardless of a user's role within the project. It pulls tasks from the Task Management System, therefore ensuring collaborators' efforts don't overwrite each other.
- Data: Use the Data tab to get an overview of every data asset in the project, regardless of status within the Task Management System.
- Instances: The Instances tab lets you use the unique instance identifier to search the project for a specific instance, and jump directly into the editor to confirm the status of an annotation visually.
Access to each tab is associated with the various project roles as follows:
| Role | Activity | Queue | Data | Instances |
|---|---|---|---|---|
| Annotator | X | X | ||
| Team Manager | X | X | X | X |
| Admin | X | X | X | X |
Activity
The activity screen allows you to quickly monitor annotation activity in your project by listing tasks and providing a summary interface to see the status of labels inside each task. Tasks are displayed in most recently edited order from top to bottom.
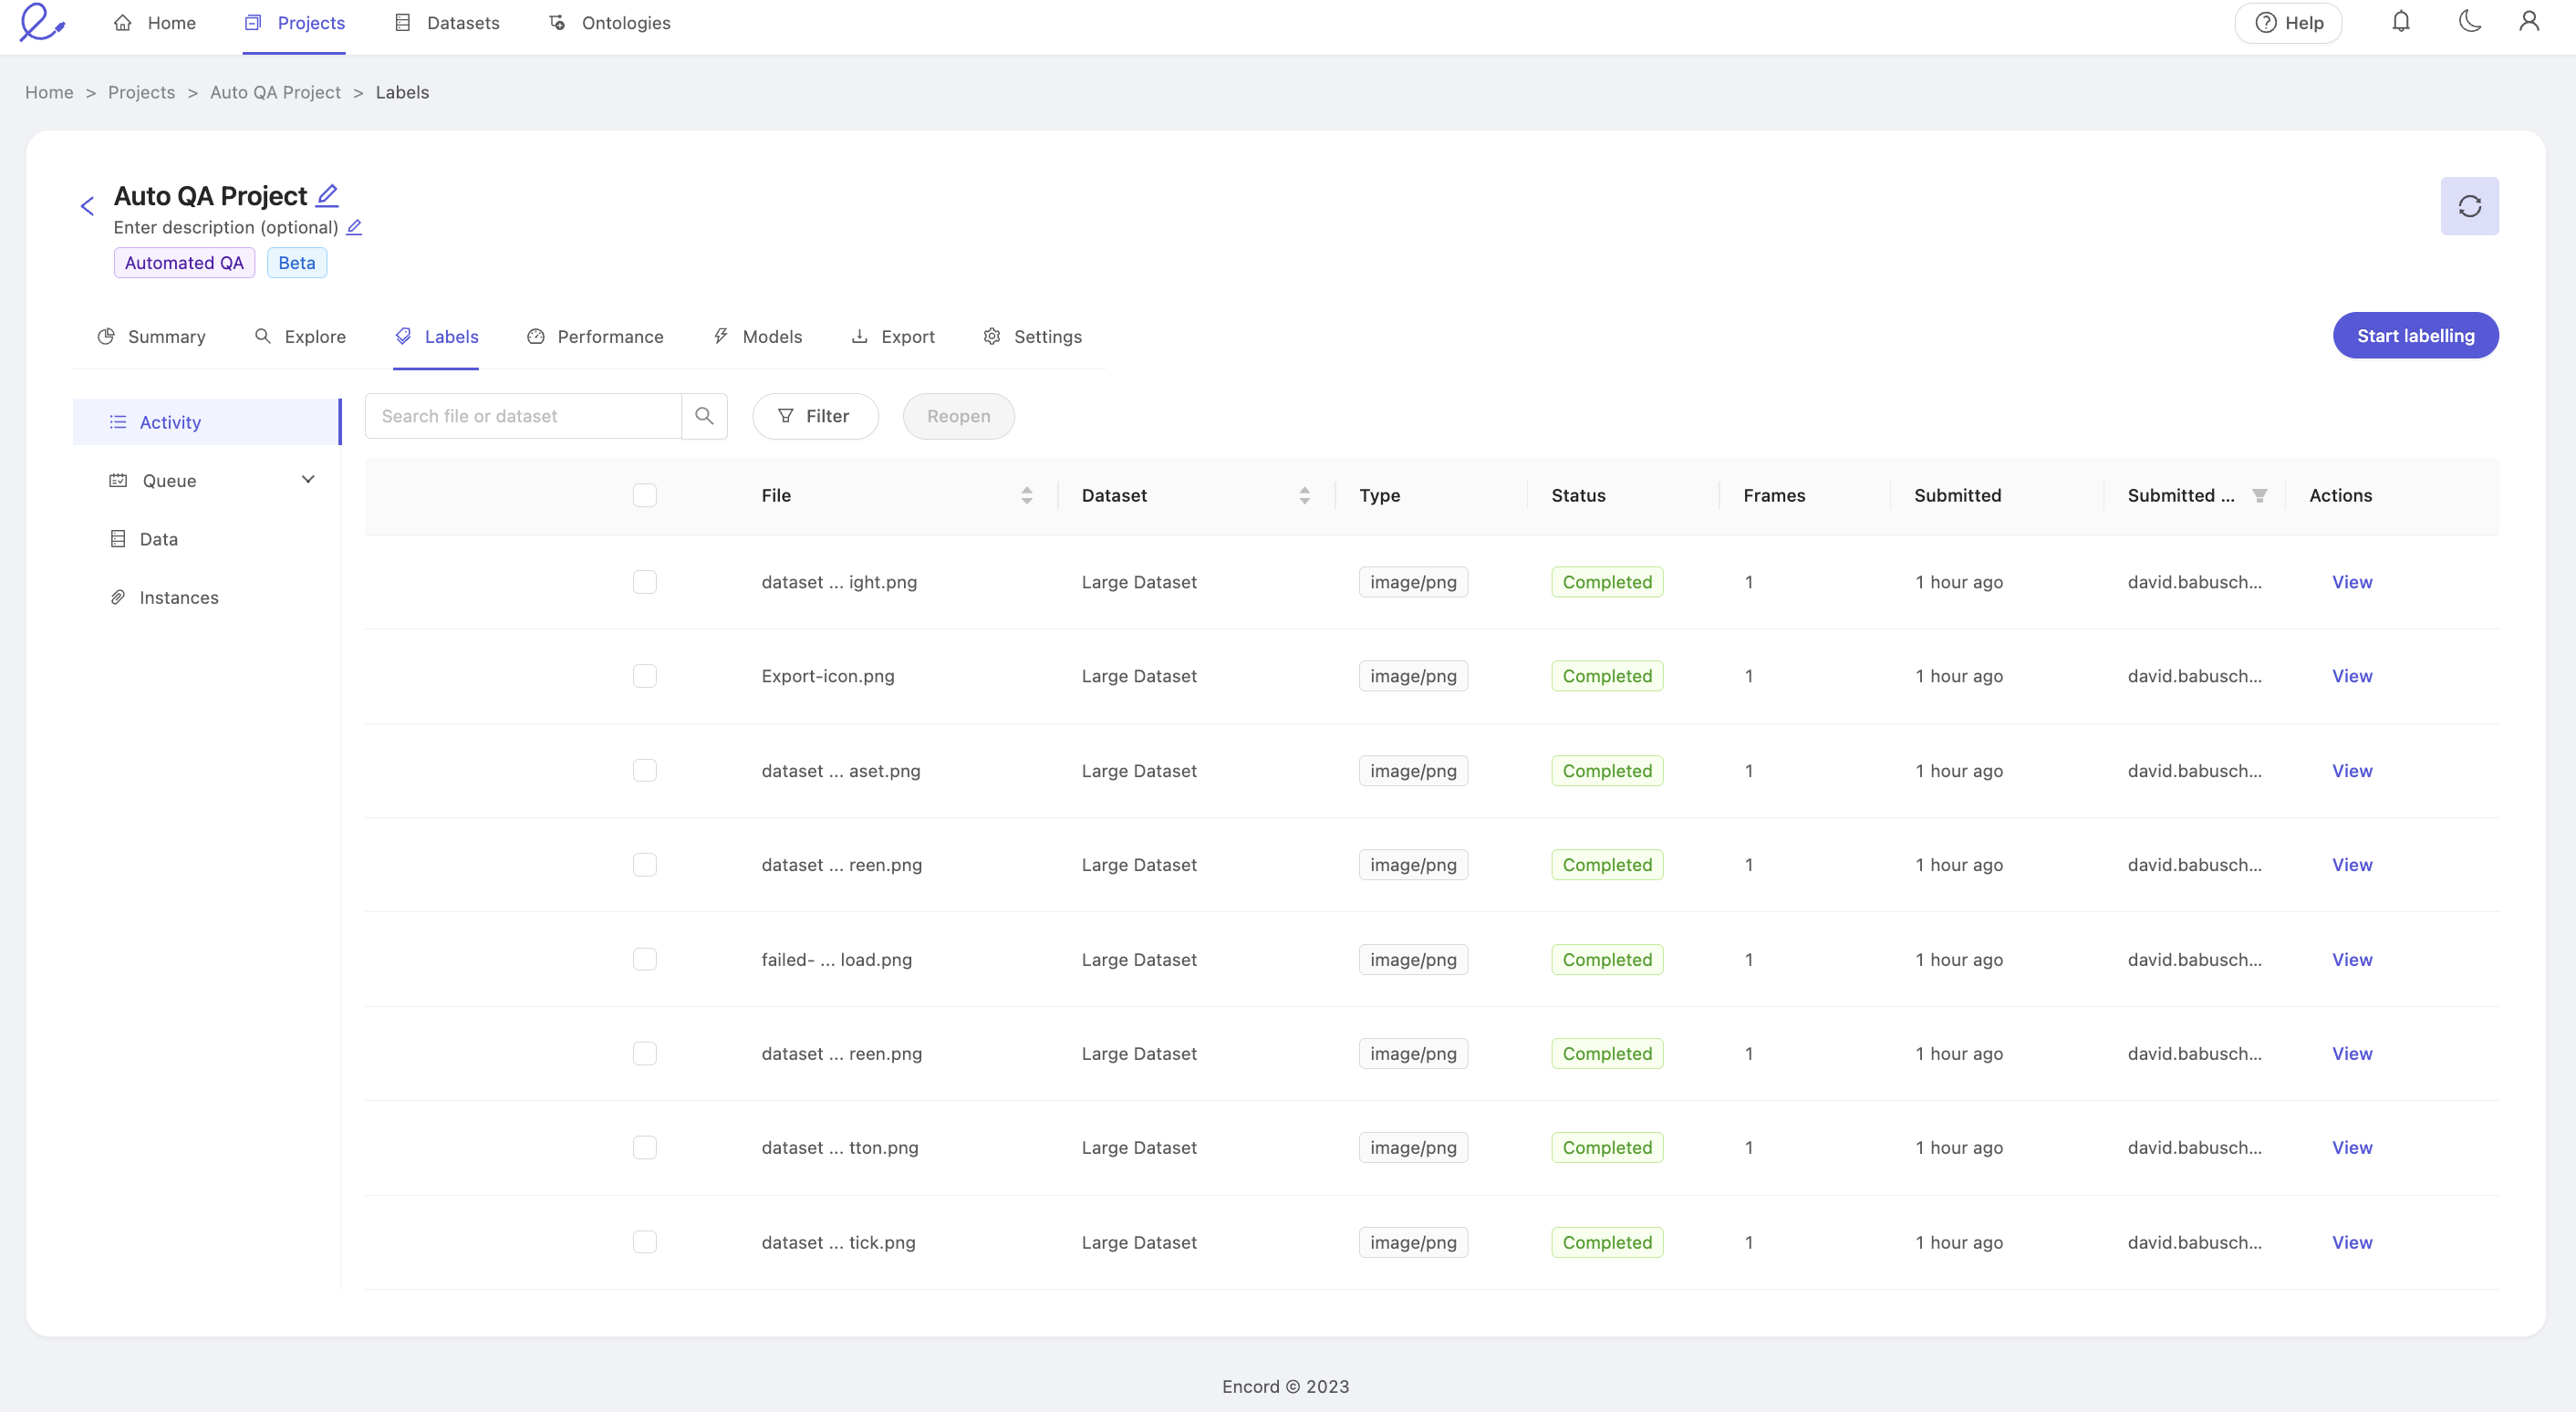
- File, Search, & Reopen: The name of the specific data unit or data asset. This is the same as the name in the dataset to which this data asset is a part of. Use the search box to filter the list by file name, and send tasks back to annotation using the 'Reopen' feature.
- Dataset: The dataset the data asset belongs to.
- Type: The type of the data, such as an image or video. For more on our supported data types, see our documentation here.
- Status: The status of the task within the Task Management System.
- Frames: The number of frames in the data asset. For a DICOM series, this will be the number of slices.
- Submitted: Indicates when the last submit action was made against any of the labels in this data asset.
- Submitted by: Who last submitted the annotations.
- Actions: Click the 'View' link to open the label editor.
We advise extra caution if you decide to edit the labels from this interface. If significant work needs to be done, we strongly recommend to 'Reopen' the task to prevent possible errors from simultaneous edits.
- Filter: Use the filter dropdown to only show tasks with the selected status.
File, Search, and Reopen
The file column shows the name of the data asset. For files uploaded via the GUI, they keep the name they were uploaded with. For files added from your cloud storage, this will normally be the path under the bucket they are stored on.
Use the search interface to quickly filter and display only those tasks with file names matching your desired text. Even partial matches will be shown. For example: searching "fly" will return file names containing "flyover" and "flyaround."
The 'Reopen' button allows Administrators and Team Managers to send tasks which are currently Completed back to annotation. Select your target tasks using the checkboxes in the File column to select individual assets, or select the checkbox in the column header to select all tasks, and press the 'Reopen' button to move all selected tasks back to the annotation stage. Tasks reopened in this way will have the status 'Returned,' in the 'Queue' tab. No labels are lost by reopening a task. The 'Reopen' action is only applied to tasks which are both visible (i.e. not filtered out by the file search) and selected.
Status
This column shows the status of this task within the Task Management System. The Activity pane only shows assets which have had some action done on them, and therefore only reflects tasks with the following statuses:
- Completed: The annotation task has been submitted and the auto review process was run. Completed task status is shown in green.
For a comprehensive summary of the possible task states, see the status section of the Data tab, below.
Queue
The 'Queue' is where annotators look to find their next task. The 'Start labeling' buttons visible throughout the project open the label editor with the next task in the queue according to the relevant task type. This tab can be used to assess the number of tasks assigned to you as an annotator and therefore estimate your likely workload. Administrators and Team Managers can also use it to quickly verify the current assignments per team member, and change assignments as necessary.
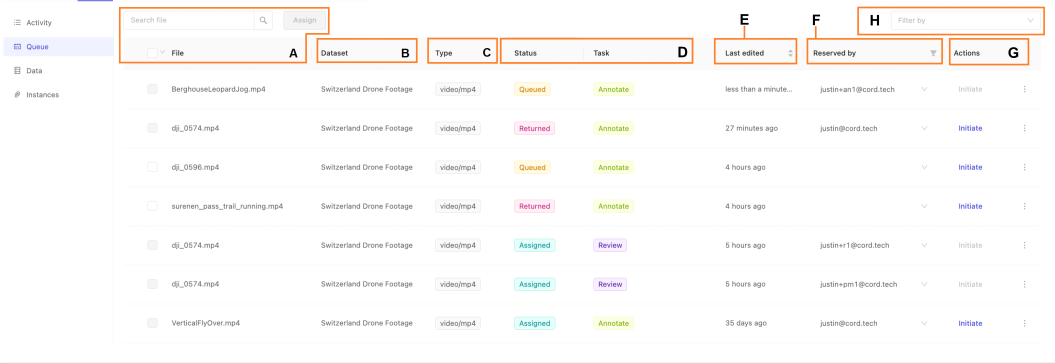
- A. File, Search, & Assign: The name of the specific data unit or data asset. This is the same as the name in the dataset to which this data asset is a part of. Use the search box to filter the list by file name, and send tasks back to annotation using the 'Reopen' feature.
- B. Dataset: The dataset the data asset belongs to.
- C. Type: The type of the data, such as an image or video. For more on our supported data types, see our documentation here.
- D. Status and Task: The status and category of this task within the Task Management System.
- E. Last Edited: When the task was last edited
- F. Reserved by: Who the task has been assigned to or reserved by
- G. Actions: Depending on your collaborator role, you can initiate or reassign the task.
- H. Filter: Use the filter drop-down to only show tasks of the selected status.
File, Search, and Assign
The file column shows the name of the data asset. For files uploaded via the GUI, they keep the name they were uploaded with. For files added from your cloud storage, this will normally be the path under the bucket they are stored on.
Use the search interface to quickly filter and display only those tasks with file names matching your desired text. Even partial matches will be shown. For example: searching "fly" will return file names containing "flyover" and "flyaround."
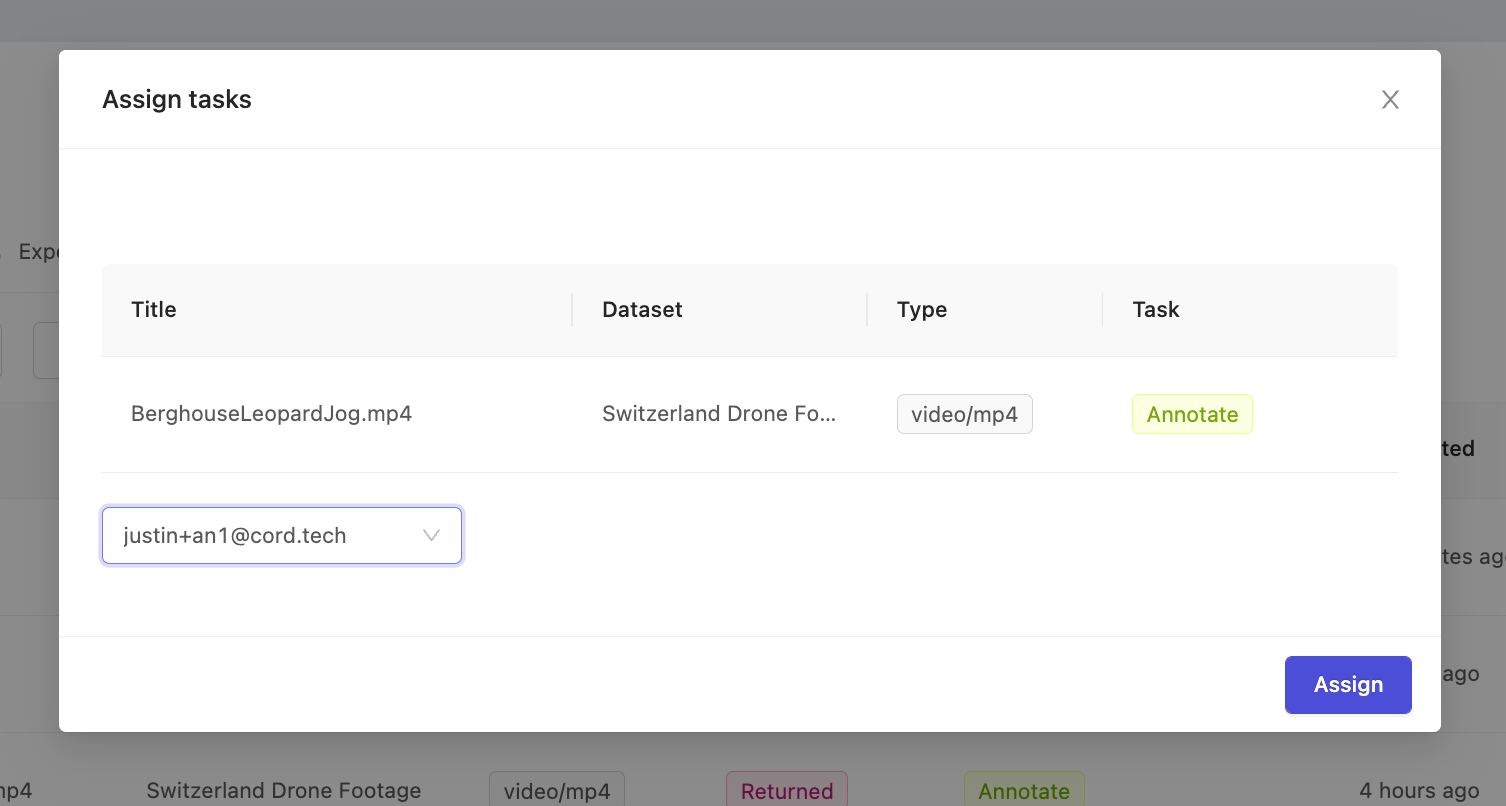
The 'Assign' button allows Administrators and Team Managers to allocate unassigned tasks to specific collaborators for annotation. Select your target tasks using the checkboxes in the File column to select individual assets, or select the checkbox in the column header to select all tasks, and press the 'Assign' button open the task assignment popup. Confirm the selected tasks are as intended, then select the target collaborator from the dropdown and press assign. Tasks which have already been assigned to another collaborator, as indicated by the email in the 'Reserved by' column, can not be reassigned until they have first been released.
Status and Task
The 'Queue' tab only shows tasks which have remaining annotation work to be done within the Task Management System (TMS). Therefore, the stage of the task within the TMS is understood by reading the Status and Task columns together.
'Annotate' tasks can be in any of the following states:
- Queued: The task is ready for annotation. To be 'Queued' it must not be assigned to a user, and must have no submitted labels. It may have been previously assigned to a user, but subsequently released before any annotations were submitted.
- Assigned: The annotation task is assigned to a specific user.
- Returned: The annotation task was previously submitted, but was 'reopened' after completion by a Team Manager or Administrator.
Actions
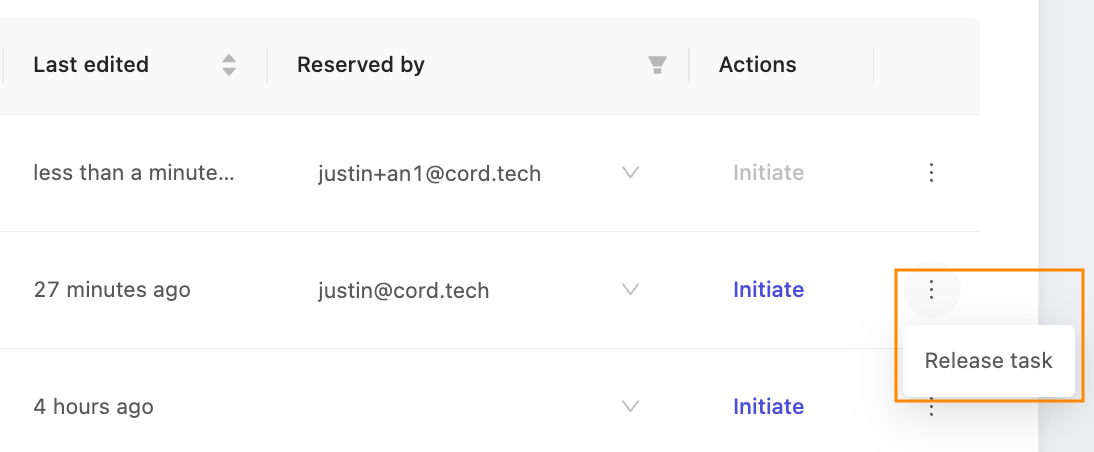
There are two relevant actions that can be done on each task from the 'Queue' pane. Press 'Initiate' to open the label editor and proceed with annotating.
Additionally, Administrators and Team Managers can click the three vertical dots to open the expanded menu, to access the 'Release task' function. Tasks must be explicitly released before they can be reassigned.
Data
The Data tab gives a complete overview of all the data asset tasks in the project, regardless of their progress through the Task Management System. Therefore, this is first place Administrators and Team Managers should check if they want to confirm the status of a given task.
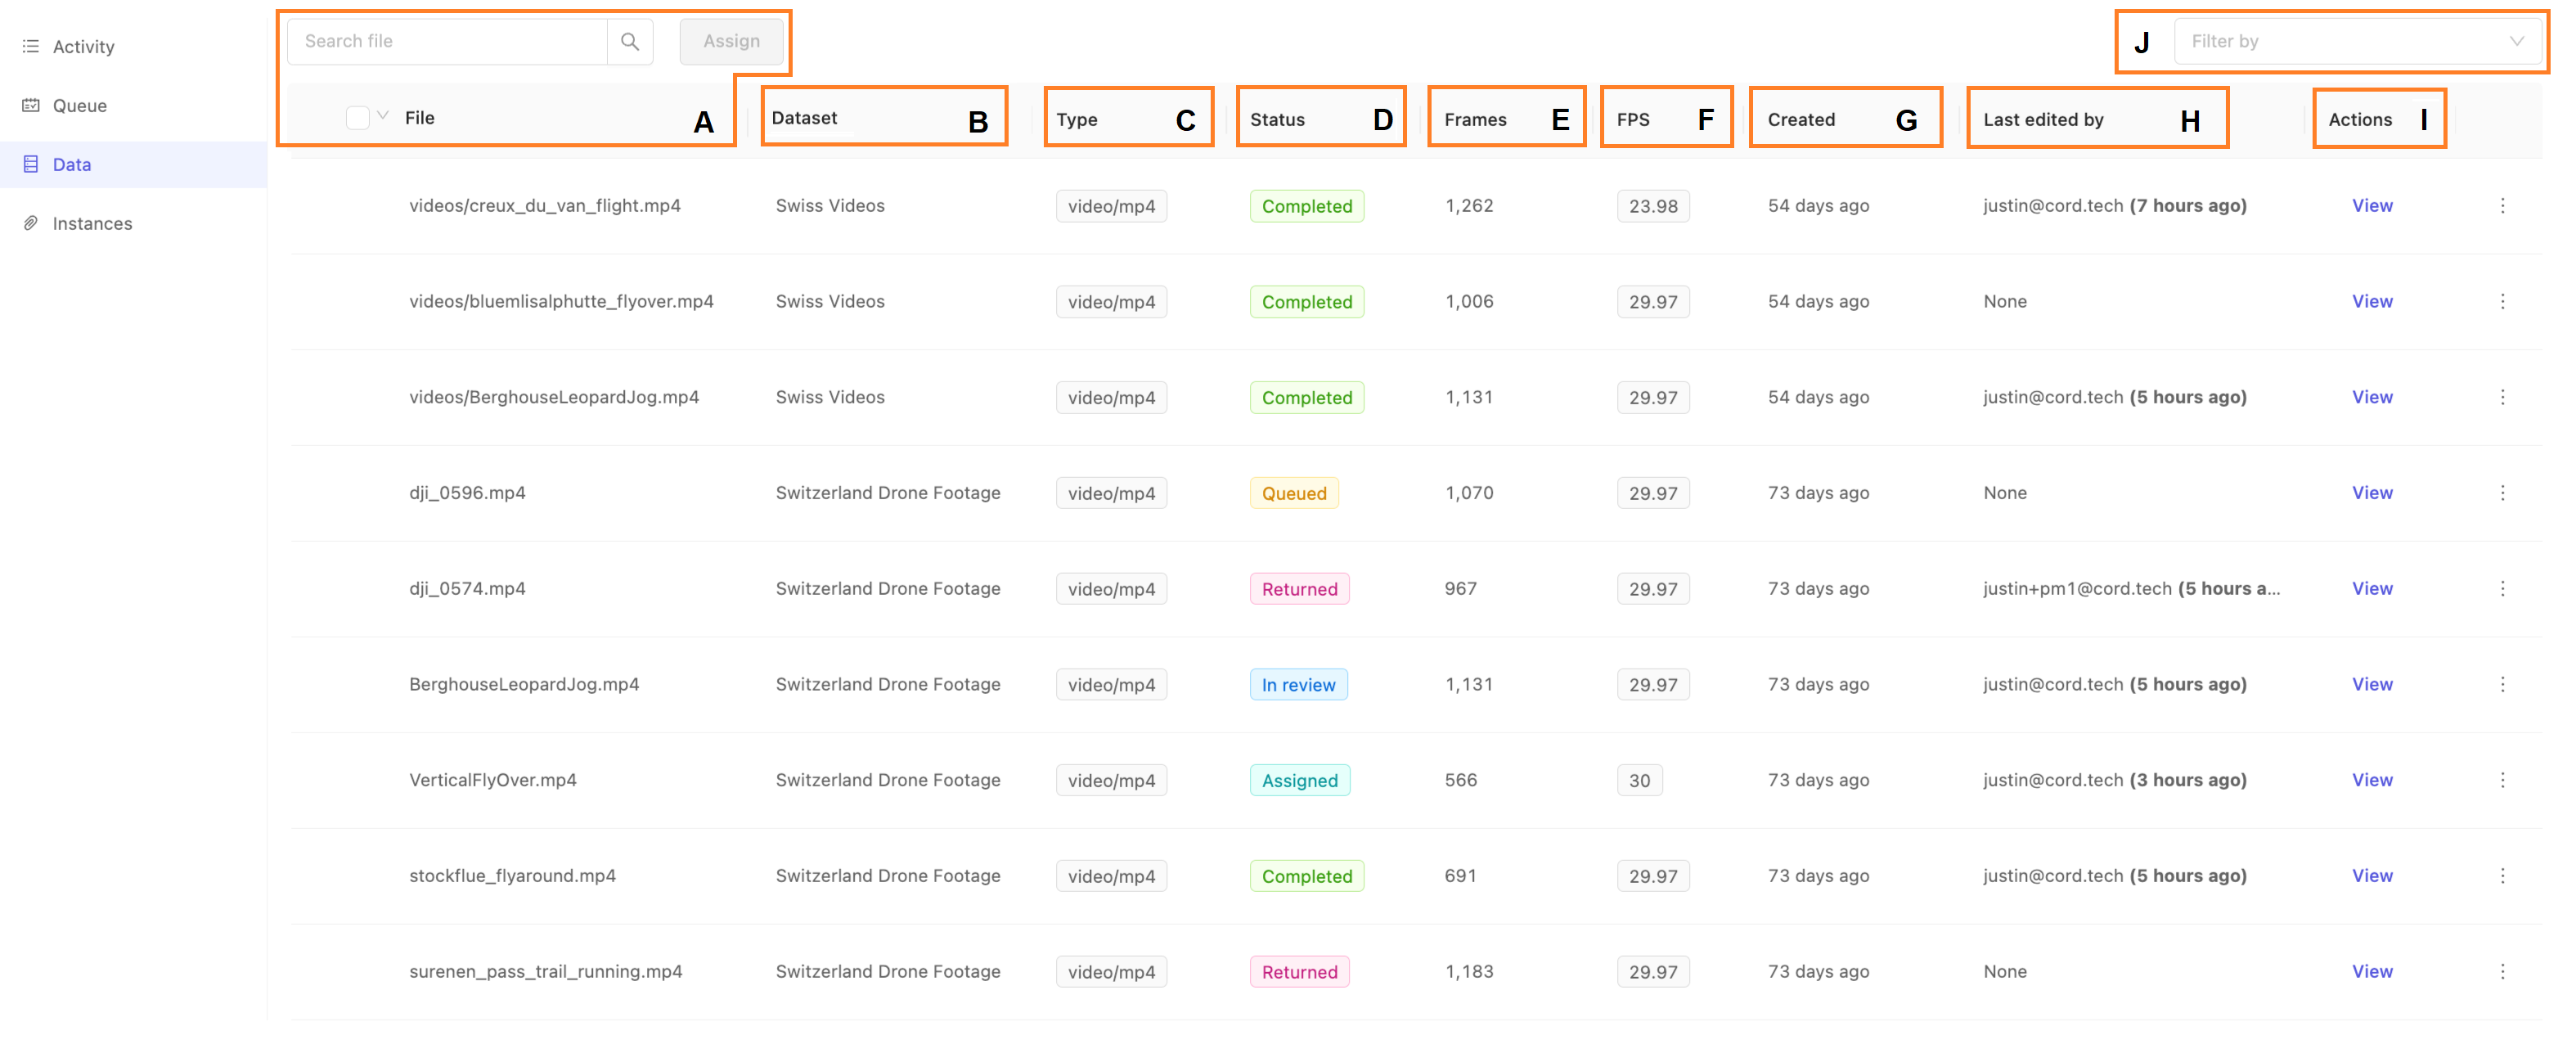
- A. File & Search: The name of the specific data unit or data asset. This is the same as the name in the dataset to which this data asset is a part of. Use the search box to filter the list by file name.
- B. Dataset: The dataset the data asset belongs to.
- C. Type: The type of the data, such as an image or video. For more on our supported data types, see our documentation here.
- D. Status: The status of this task within the Task Management System.
- E. Frames: The total frames in this data asset. This will apply to videos, image sequences and DICOM. Images always only have 1 frame.
- F. FPS: the frames per second of the data asset. This only applies for data of type video. Others will show a dash (
-). - G. Created: When the task was created. Tasks are created when the dataset containing the data asset is attached to the project.
- H. Last edited by: the last collaborator who edited the task in any capacity, and when.
- I. Actions: The 'Data' tab allows users to view the task in the label editor, as well as get a code snippet for using the SDK with this task, and confirming the edit actions via the Activity Log.
- J. Filter by: Use the filter dropdown to view only tasks with the selected Status.
File and Search
The file column shows the name of the data asset. For files uploaded via the GUI, they keep the name they were uploaded with. For files added from your cloud storage, this will normally be the path under the bucket they are stored on.
Use the search interface to quickly filter and display only those tasks with file names matching your desired text. Even partial matches will be shown. For example: searching "fly" will return file names containing "flyover" and "flyaround."
Status
The data tab provides the most comprehensive overview of all the tasks associated with each data asset in a given project. As such, this is the first place to check to see the status of various tasks.
- Queued: The task is ready for annotation. For a task to be 'Queued' it must not be assigned to a user, and have no submitted labels. A queued task may have been previously assigned to a user, but subsequently released before any annotations were submitted. Queued tasks are shown in light orange.
- Assigned: An annotation task has been assigned to a specific user. Assigned tasks are shown in aqua green.
- Returned: The task was previously submitted, but was 'reopened' after completion by a team manager or administrator.
- Completed: The annotation task has been submitted and the review process was run. Completed task status is shown in green.
Actions
Clicking View will drop you into the label editor to do a live audit of the annotations in this data asset. The 'Data' tab is only visible to Administrators and Team Managers and so grants great power to view any data asset, however appropriate care must be taken to ensure annotations are not simultaneously edited from the 'Queue' pane by an annotator. Encord advises edit actions are NOT taken from the Data tab unless you have received confirmation no one else is concurrently editing the asset.
In order to prevent any possible issues of annotator work being overwritten, it's critical that all annotations are done via the Task Management System's Queue tab, and only the person assigned to the task makes annotations at any given time.
Other possible actions include 'API Details' which show a popup with sample code you can use to get started with our SDK to access this particular data asset, often known as a label row in the SDK. Click 'Activity log' to see a popup with a graphical summary of add / edit / delete actions on this data asset indexed by annotator or ontology class. Click 'Display logs' in the lower right to show all actions in reverse chronological order.
Instances
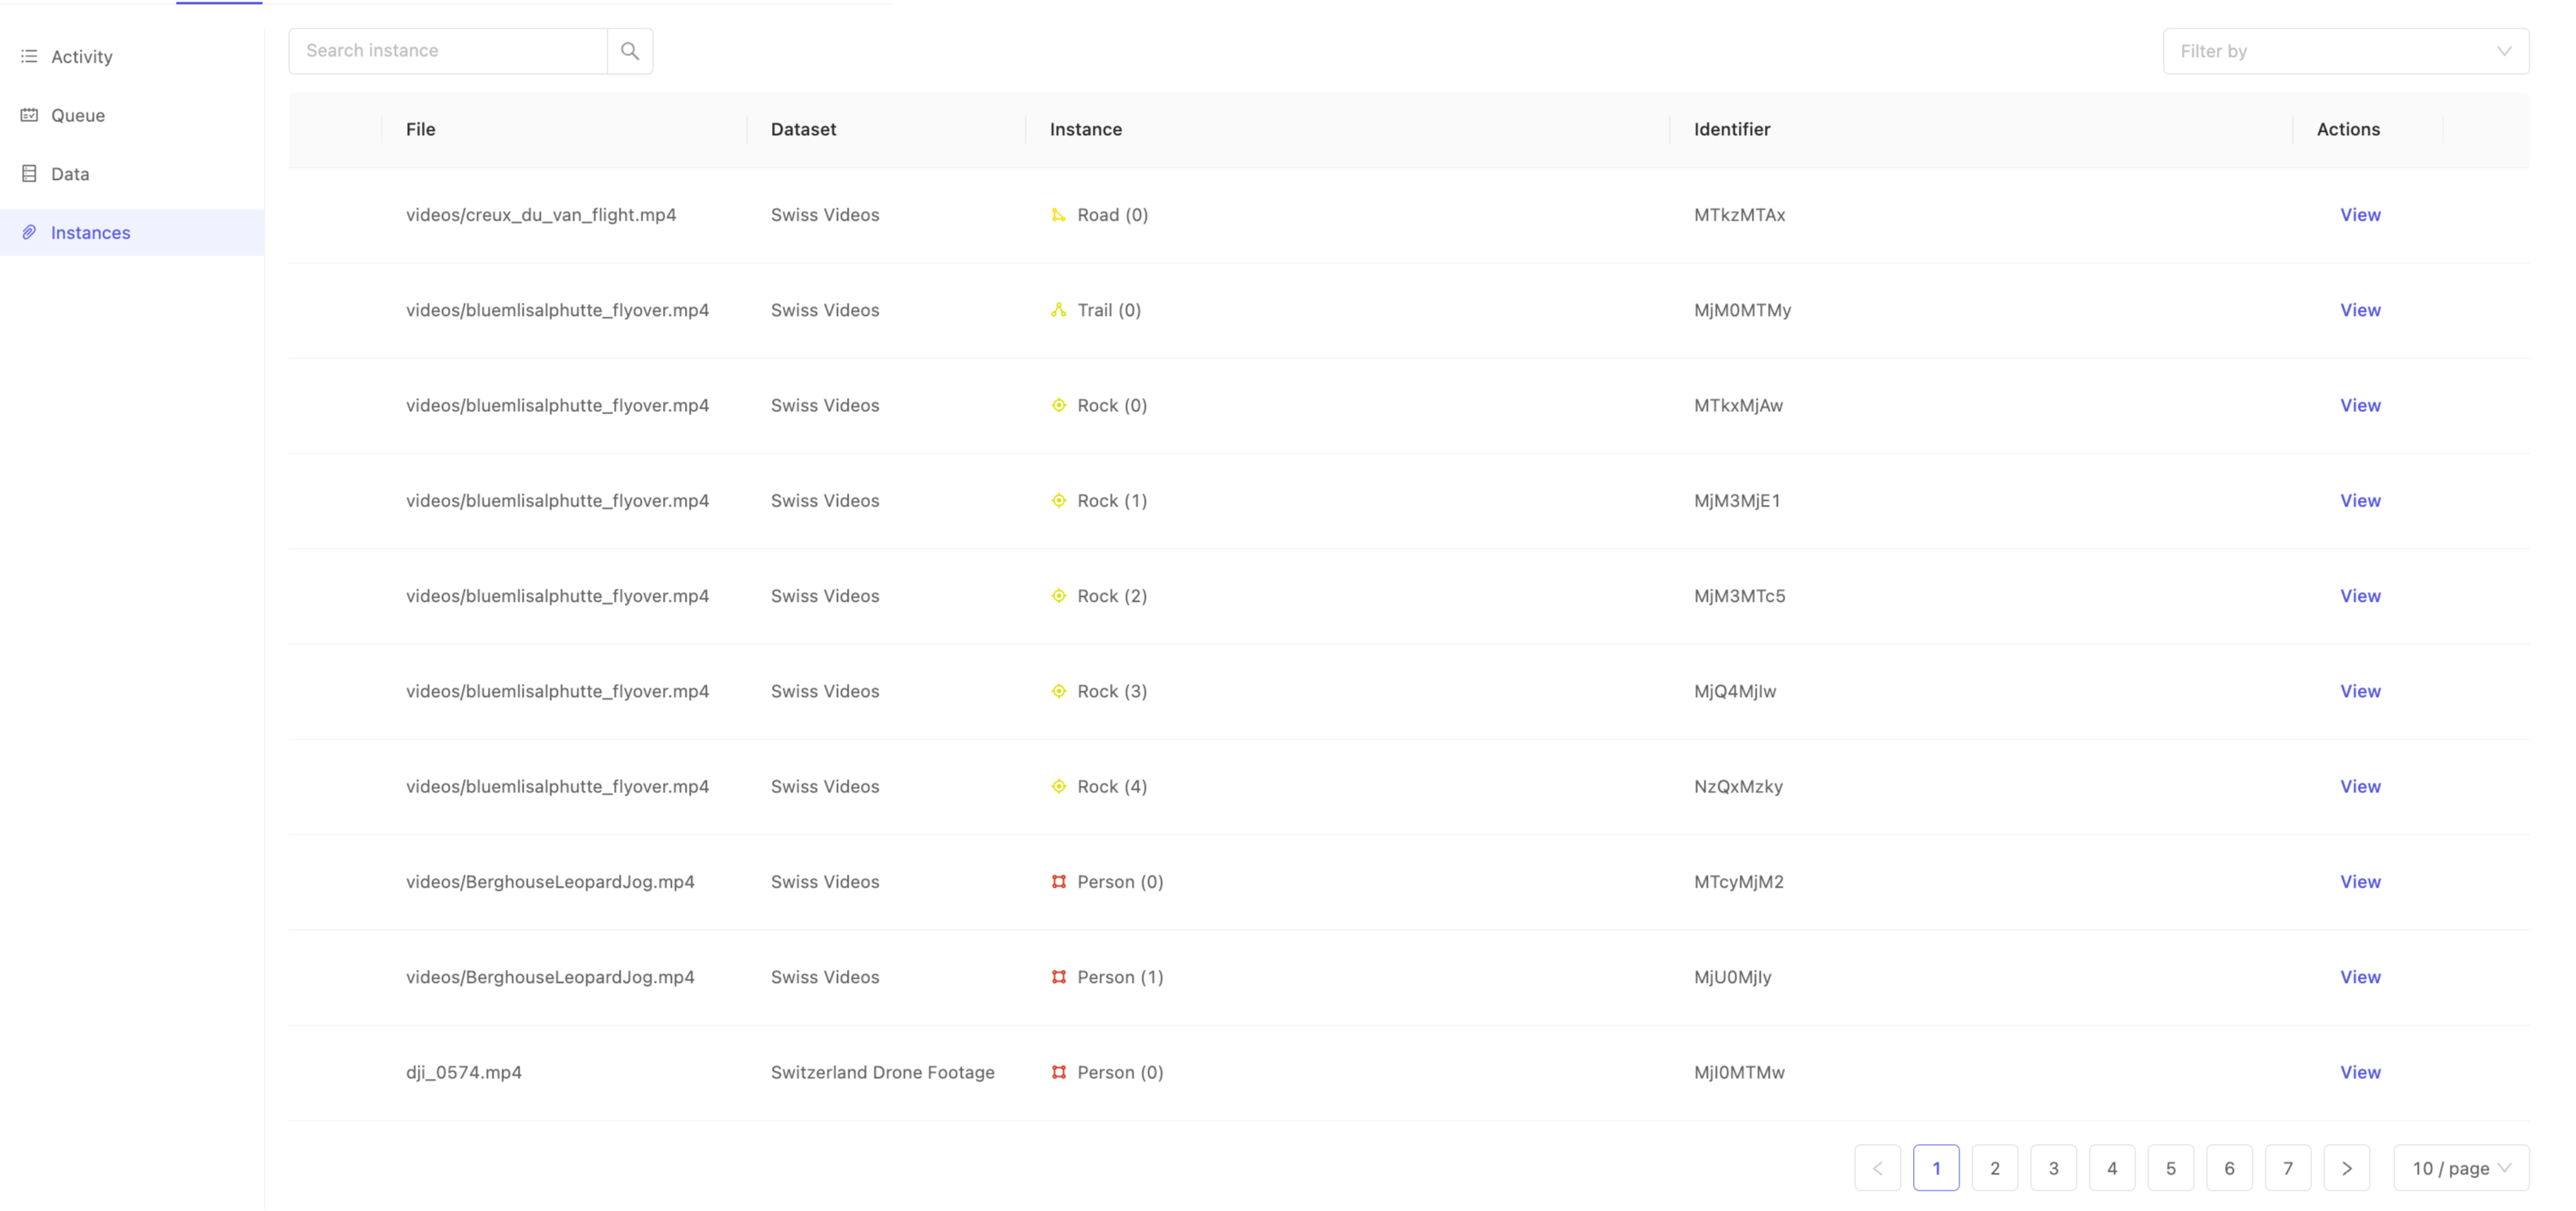
The 'Instances' tab allows Administrators and Team Managers to search within the data to directly find specific instances. Recall that an annotation instance correlates to a unique instantiation of a specific ontology class in a data asset. For example, if you have the 'Person' class in your ontology, the first instance of a 'Person' in a given data asset will be indicated in the interface as 'Person (0)', the second as 'Person (1)' and so on. Instances, therefore, can exist in multiple frames of a data asset, and indicate the same object. Use the 'Instances' tab to search for specific instances of objects or classifications using their Identifier.
Instance identifiers are unique at the project scope, and can be found in any of the following ways:
- From inside the label editor, by clicking on a particular instance, and then selecting 'Copy identifier' from the instance action menu.
- From inside exported labels, where they are known as the
objectHashorclassificationHashas appropriate. - When uploading labels using the SDK, you may specify your own
objectHashorclassificationHash.
Once you have an identifier of interest, use the 'Search instance' interface to filter the instances by identifier to quickly find the instance you're interested in. This can be particularly handy when you want to visually confirm an annotation you may not have seen before, but for which you have the identifier.
After locating your instance of interest, click View from the 'Actions' column to jump deeply into the dataset straight to where the instance is first annotated.
Performance - Summary
The 'Summary' tab of the performance dashboard provides an overview of your team's labeling and productivity. You're able to switch between a summary, or detailed view of performance metrics using the toggle found at the top of the 'Performance' tab.
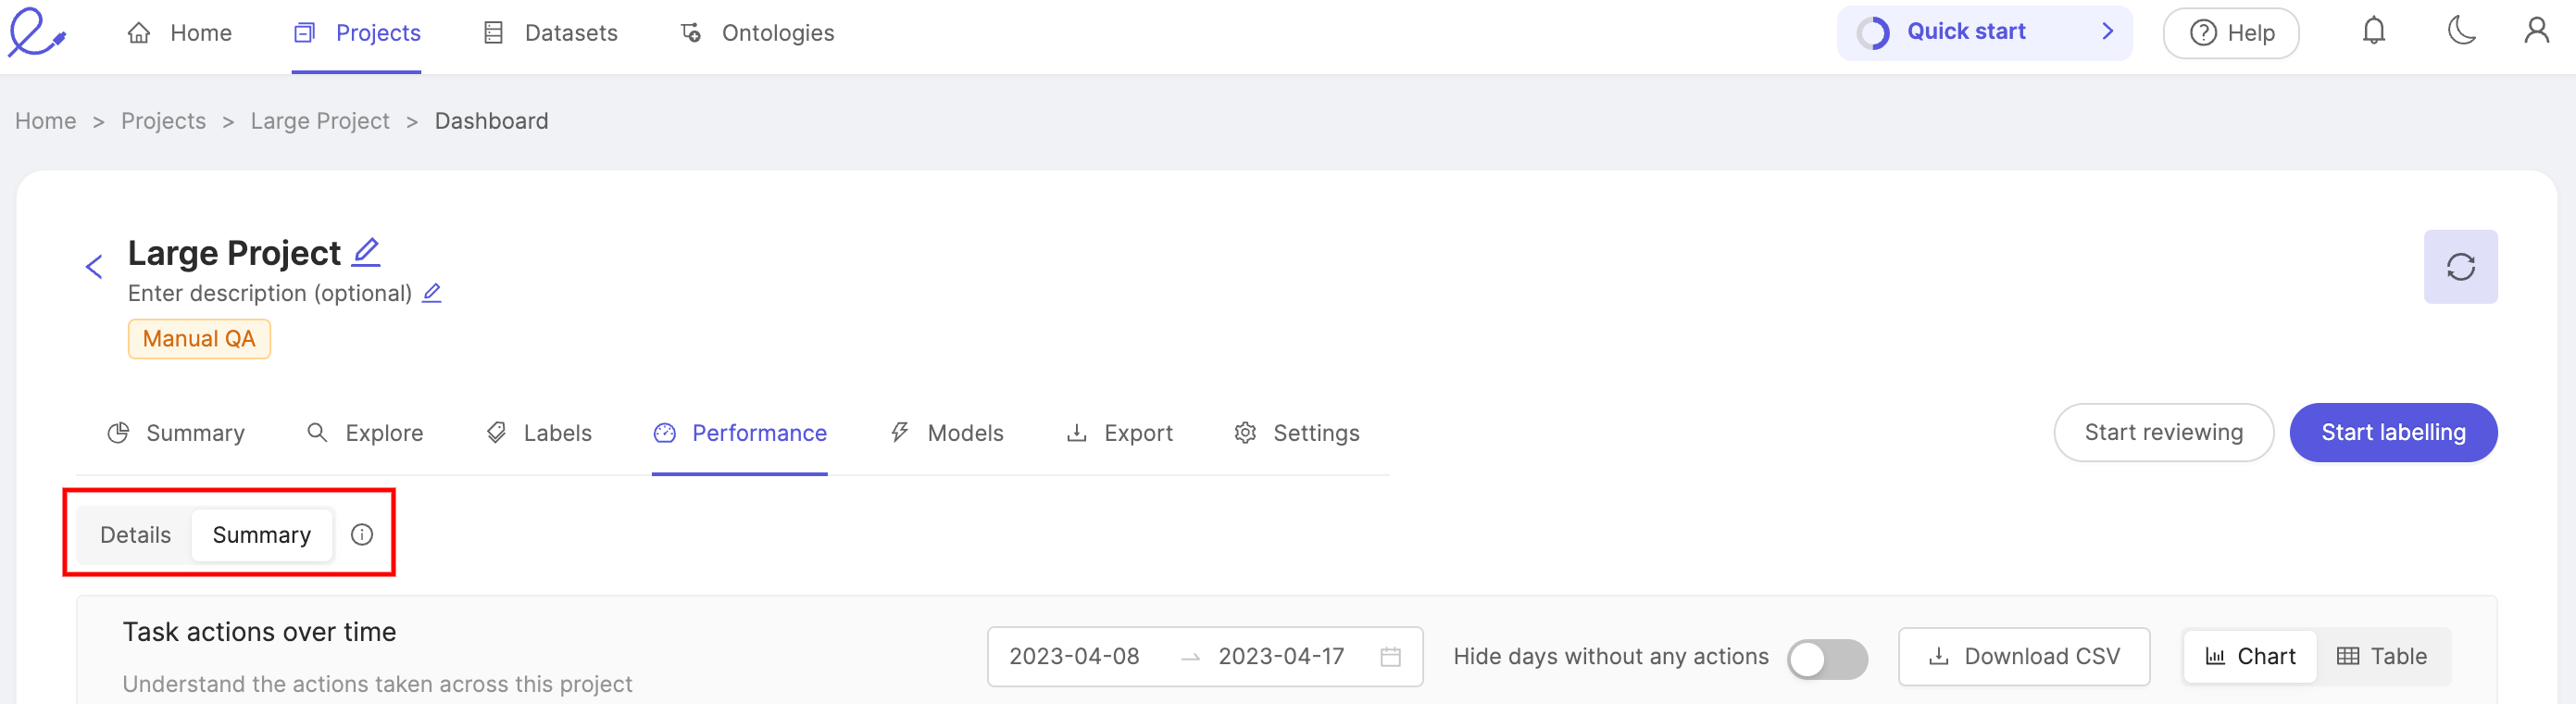
Task actions over time
View the number of tasks in a project that have been approved, rejected, and submitted for review over a given period of time.
- The height of a bar represents the total number of tasks.
- The height of each color within a bar represents the number of approved, rejected, and submitted tasks.
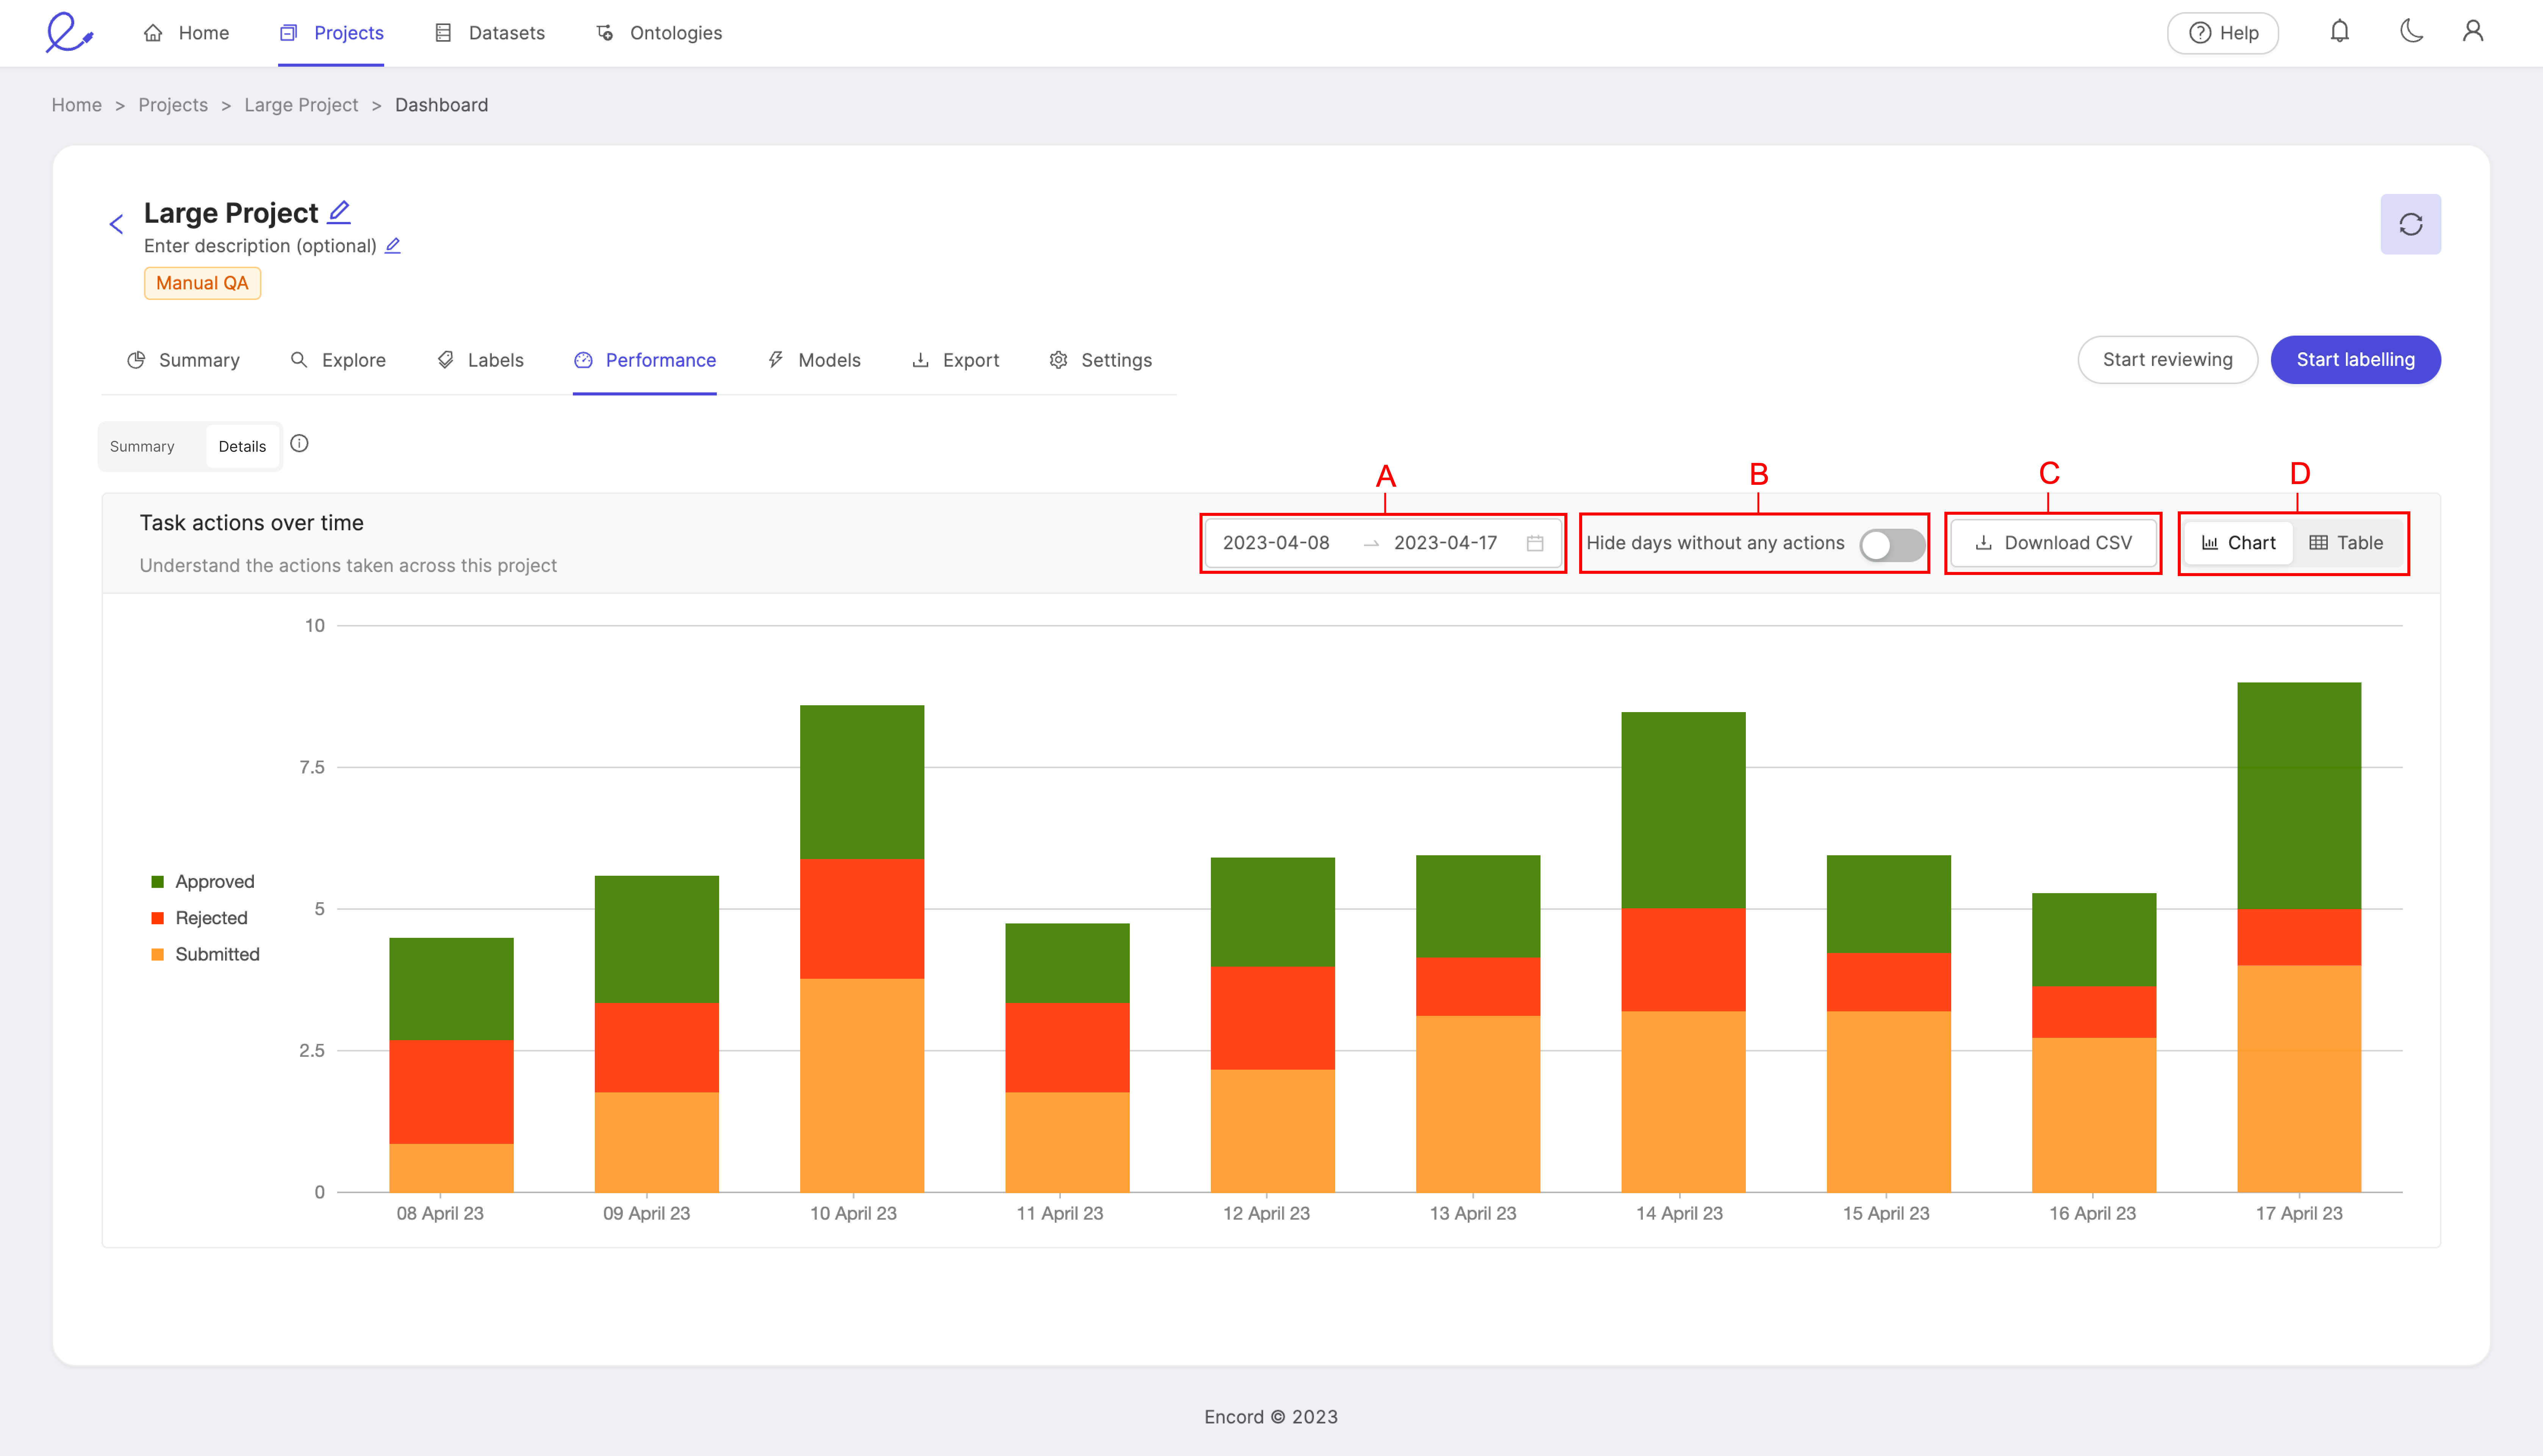
- A: Set the time period you would like to see displayed by selecting a range of dates.
- B: The Hide days without any actions toggle removes all days at which no actions were taken from the view.
- C: Download a CSV file of the data.
- D: Display the data as a bar chart, or a table. While the chart provides a clear visual representation, the table provides exact figures for a more detailed picture of your team's performance.
Instance Label actions over time
View the number of instance label actions in a project that have been approved, rejected, and submitted for review over a given period of time.
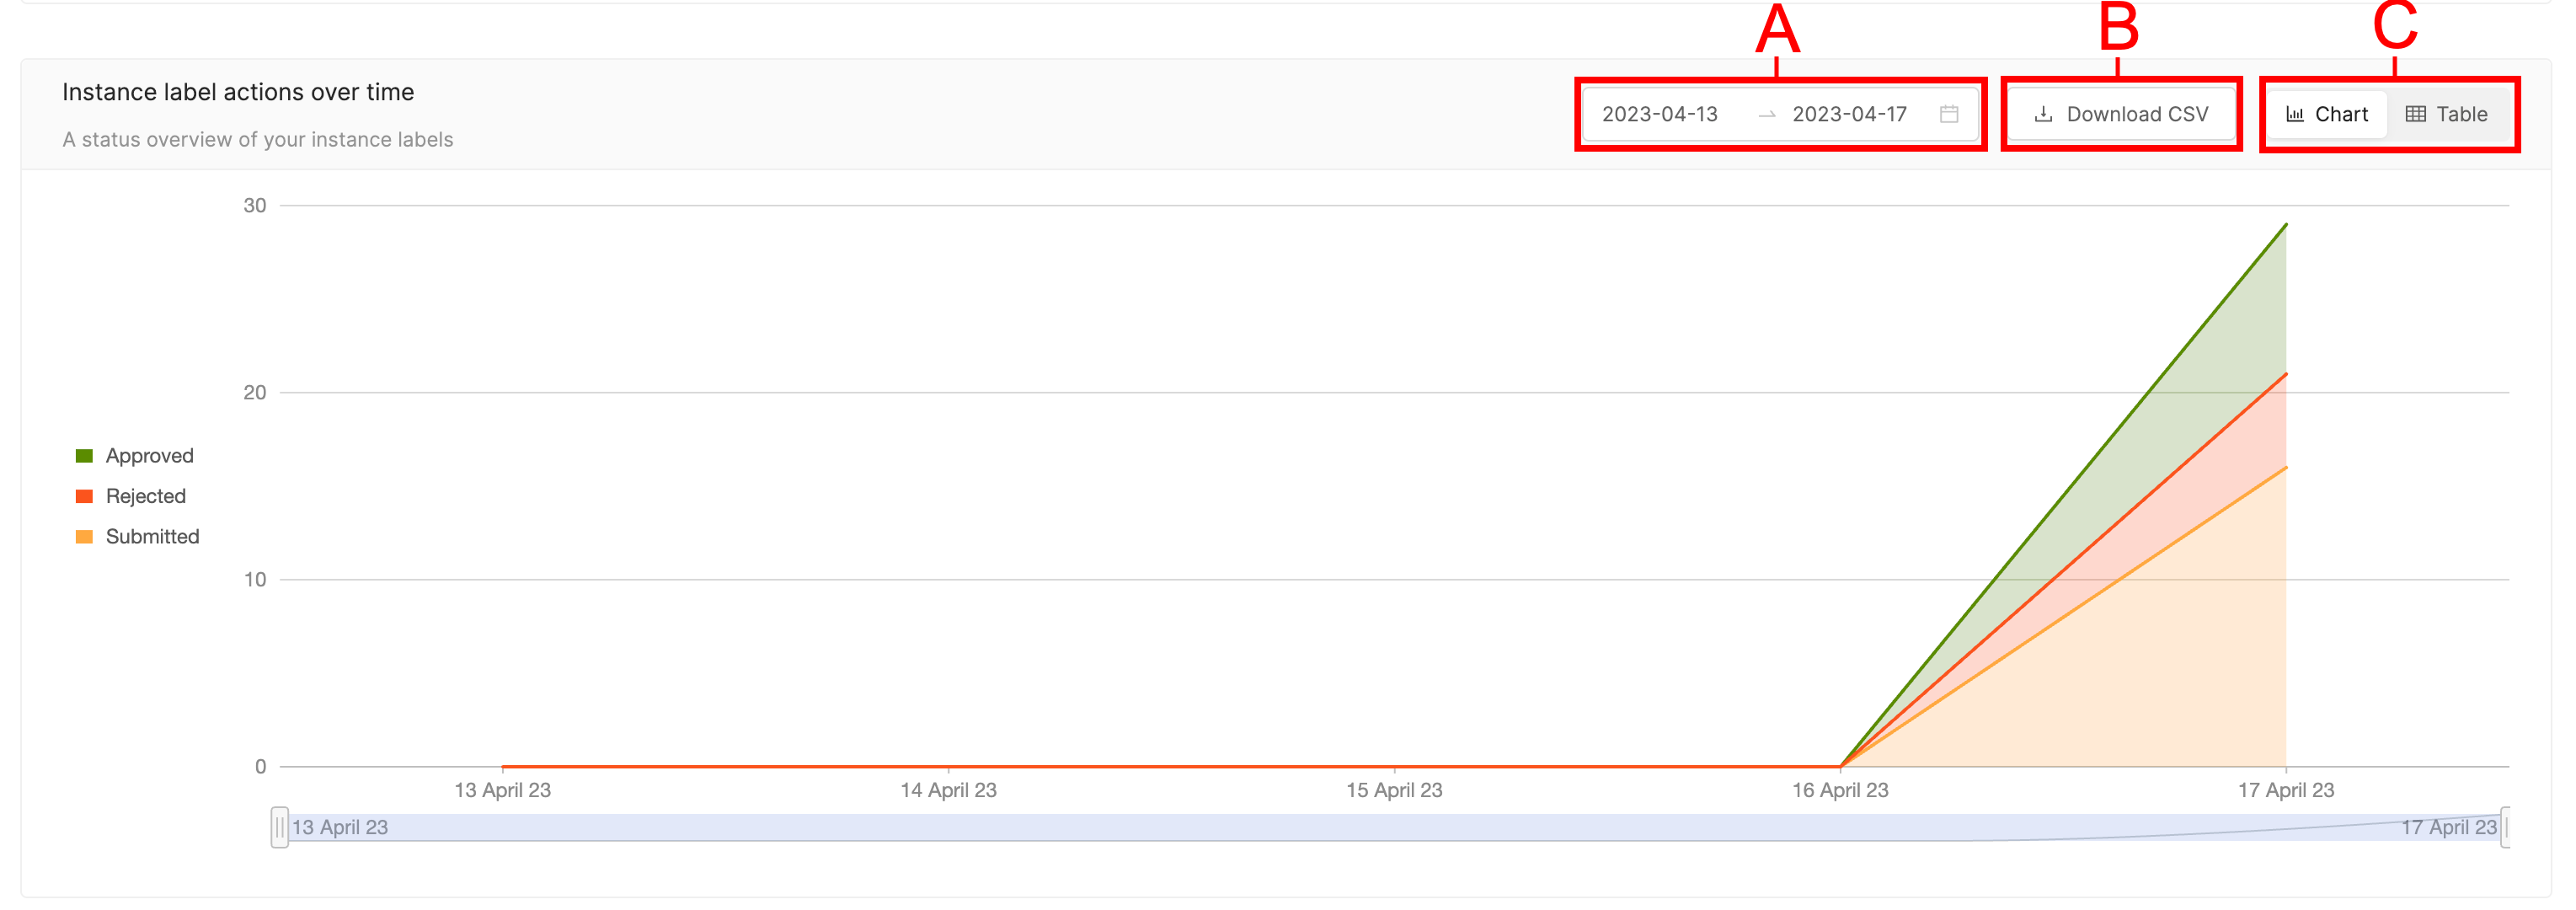
- A: Set the time period you would like to see displayed by selecting a range of dates.
- B: Download a CSV file of the data.
- C: Display the data as a bar chart, or a table. While the chart provides a clear visual representation, the table provides exact figures for a more detailed picture of your team's performance.
Within your specified time period, you can choose which dates to display by using the slider located beneath the graph.
Team collaborators
The 'Team collaborators' section the duration of time each project collaborator spend working on a given file.
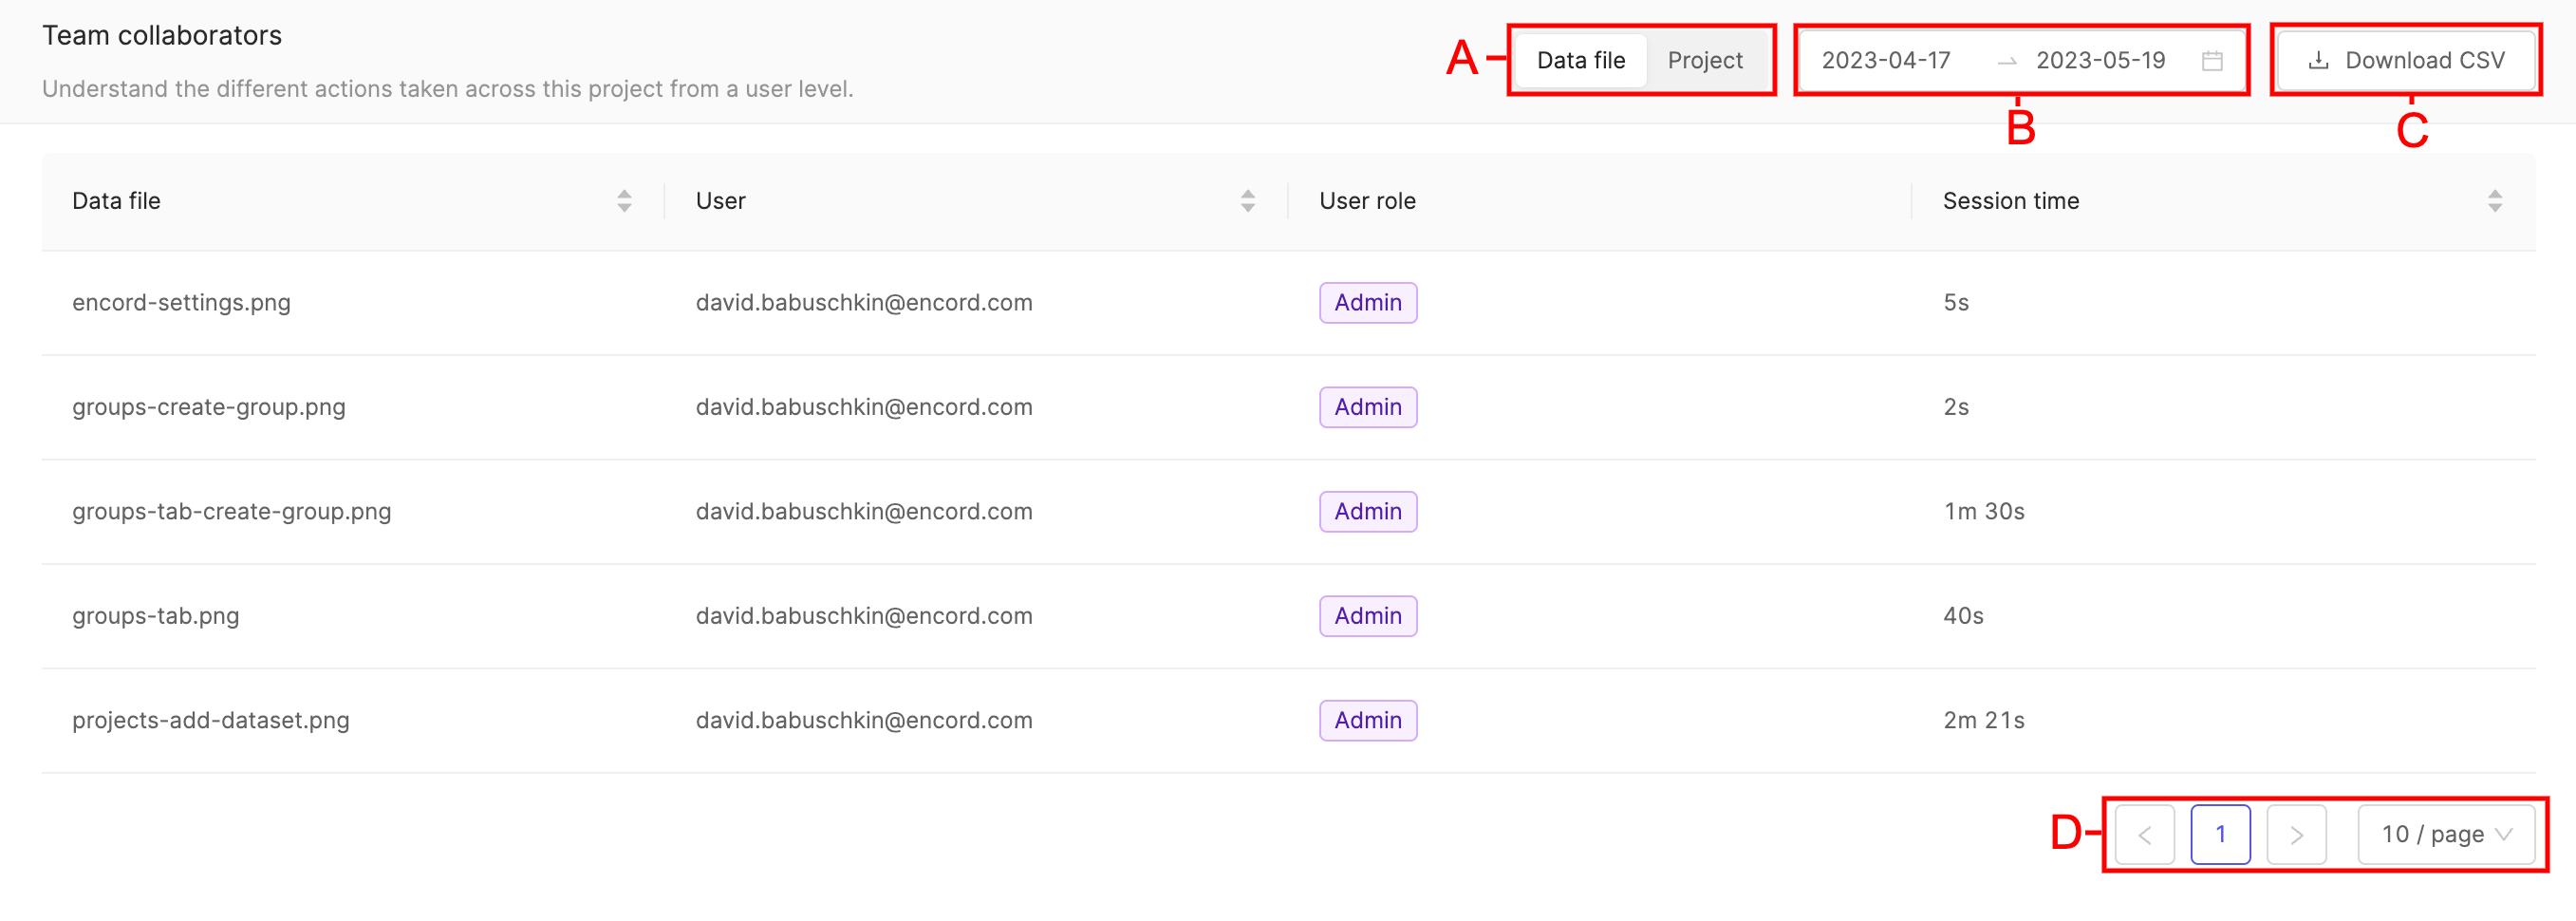
A. 'Data file' displays session time collaborators spent working on individual files. 'Project' displays session time collaborators have spent working on the project.
B. Table entries can be filtered according to dates by clicking the range of dates, and selecting the start and end date of the period you would like to see table entries displayed for.
C. Table entries can be downloaded in CSV format by clicking the Download CSV button.
D. When lots of entries are present they will be split across a number of different pages. The number of table entries per table can be adjusted.
Performance - Details
The 'Details' tab of the performance dashboard gives a more detailed view of your team's labeling and productivity. You're able to switch between a summary, or detailed view of performance metrics using the toggle found at the top of the 'Performance' tab.
There are two global filters that can be applied to the entire dashboard:
- Date range: sets the date boundaries for the statistics shown on the dashboard.
- Labels or instances: how your labels are distributed across datasets, objects and classifications.
- More information here.
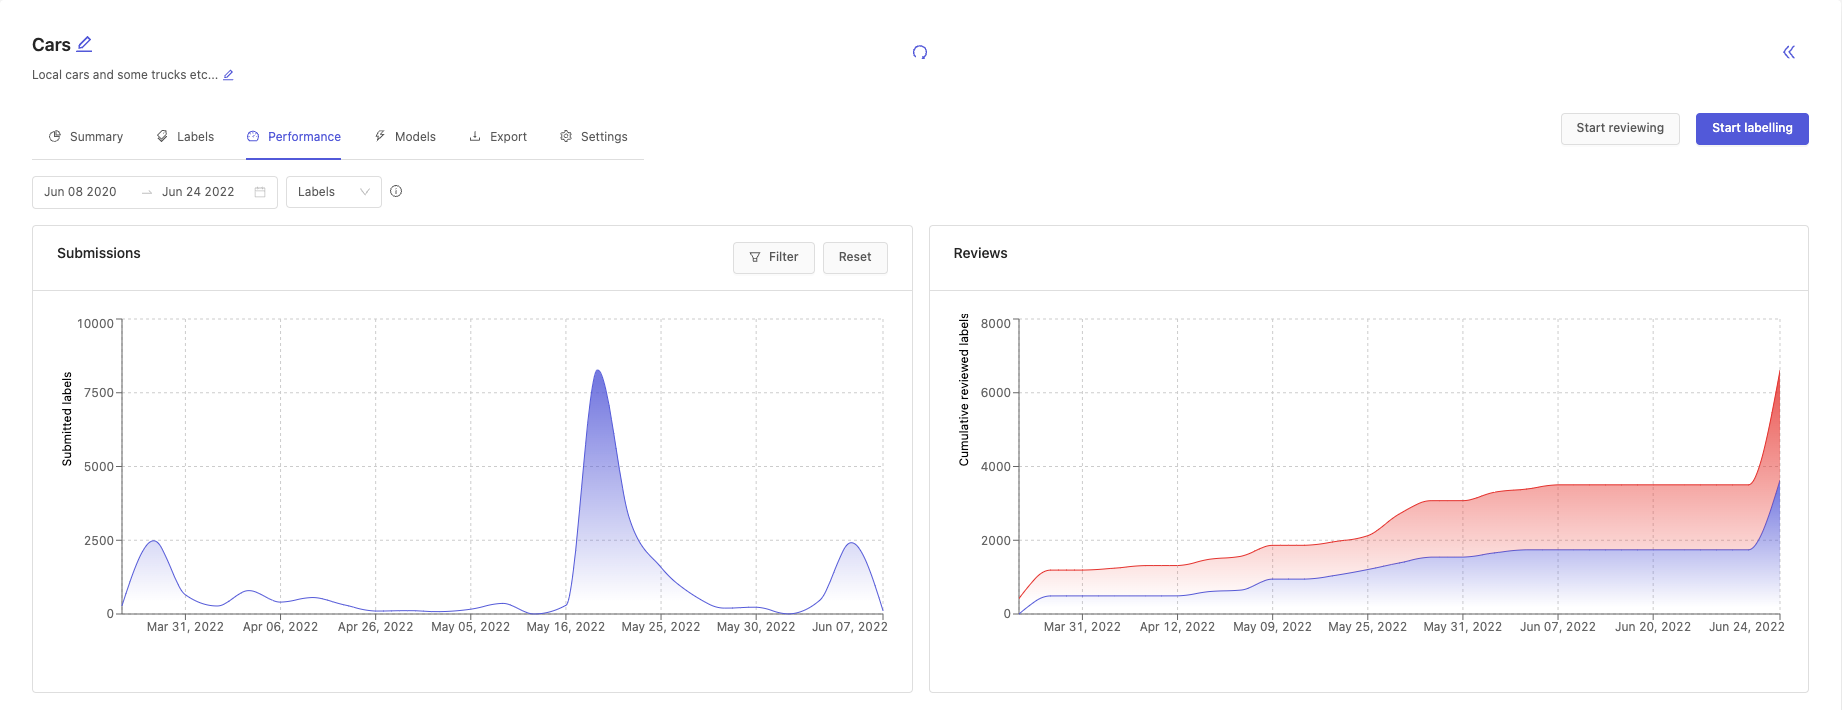
Submissions chart
The submissions chart displays the number of submitted labels or instances over the specified time period. The chart can be filtered to show submissions for specific annotators or classes.
If you filter on both Annotators and Classes then the resulting chart will show the submission statistics for the selected annotators and the selected labels.
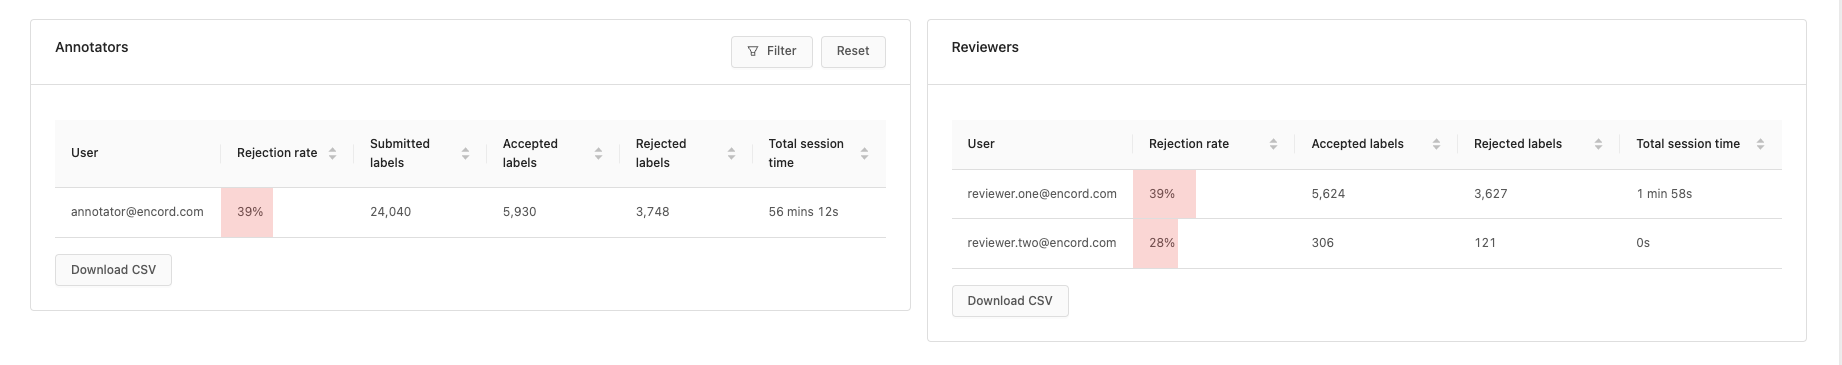
Annotators' table
The annotators' table displays all the relevant statistics for all annotators in a project. It can be filtered on classes to show annotator statistics only for the selected classes.
Table columns
- Total benchmark tasks: Total number of benchmark tasks in the project.
- Submitted benchmark tasks: Number of benchmark tasks in the project that have been submitted.
- Benchmark result: The overall score according to the benchmark function provided during the automated review process.
- Progress: The percentage of benchmark tasks that have been reviewed.
Models
Models are top-level entities that can automate labeling in a variety of use cases.
Please see our documentation on models to learn how to create, train, and attach different models to projects.
Export
After you or your team has generated labels, you can export them in JSON and COCO format. Labels can be exported from the Encord Web app or the SDK.
Export data from the Encord web app
Click the Export tab inside a project to access the export screen. Configure the export operation by using the Export options, Configure data, and Export labels tabs as follows:
- Export options
- Format: We currently support exports in two native formats, a JSON file with file metadata and labels organized per frame and COCO, a large-scale object detection, segmentation, and captioning dataset. Encord's native export format is described here.
- Type: For JSON, select either or both the Classifications and Objects labeling. For COCO, select Objects labeling.
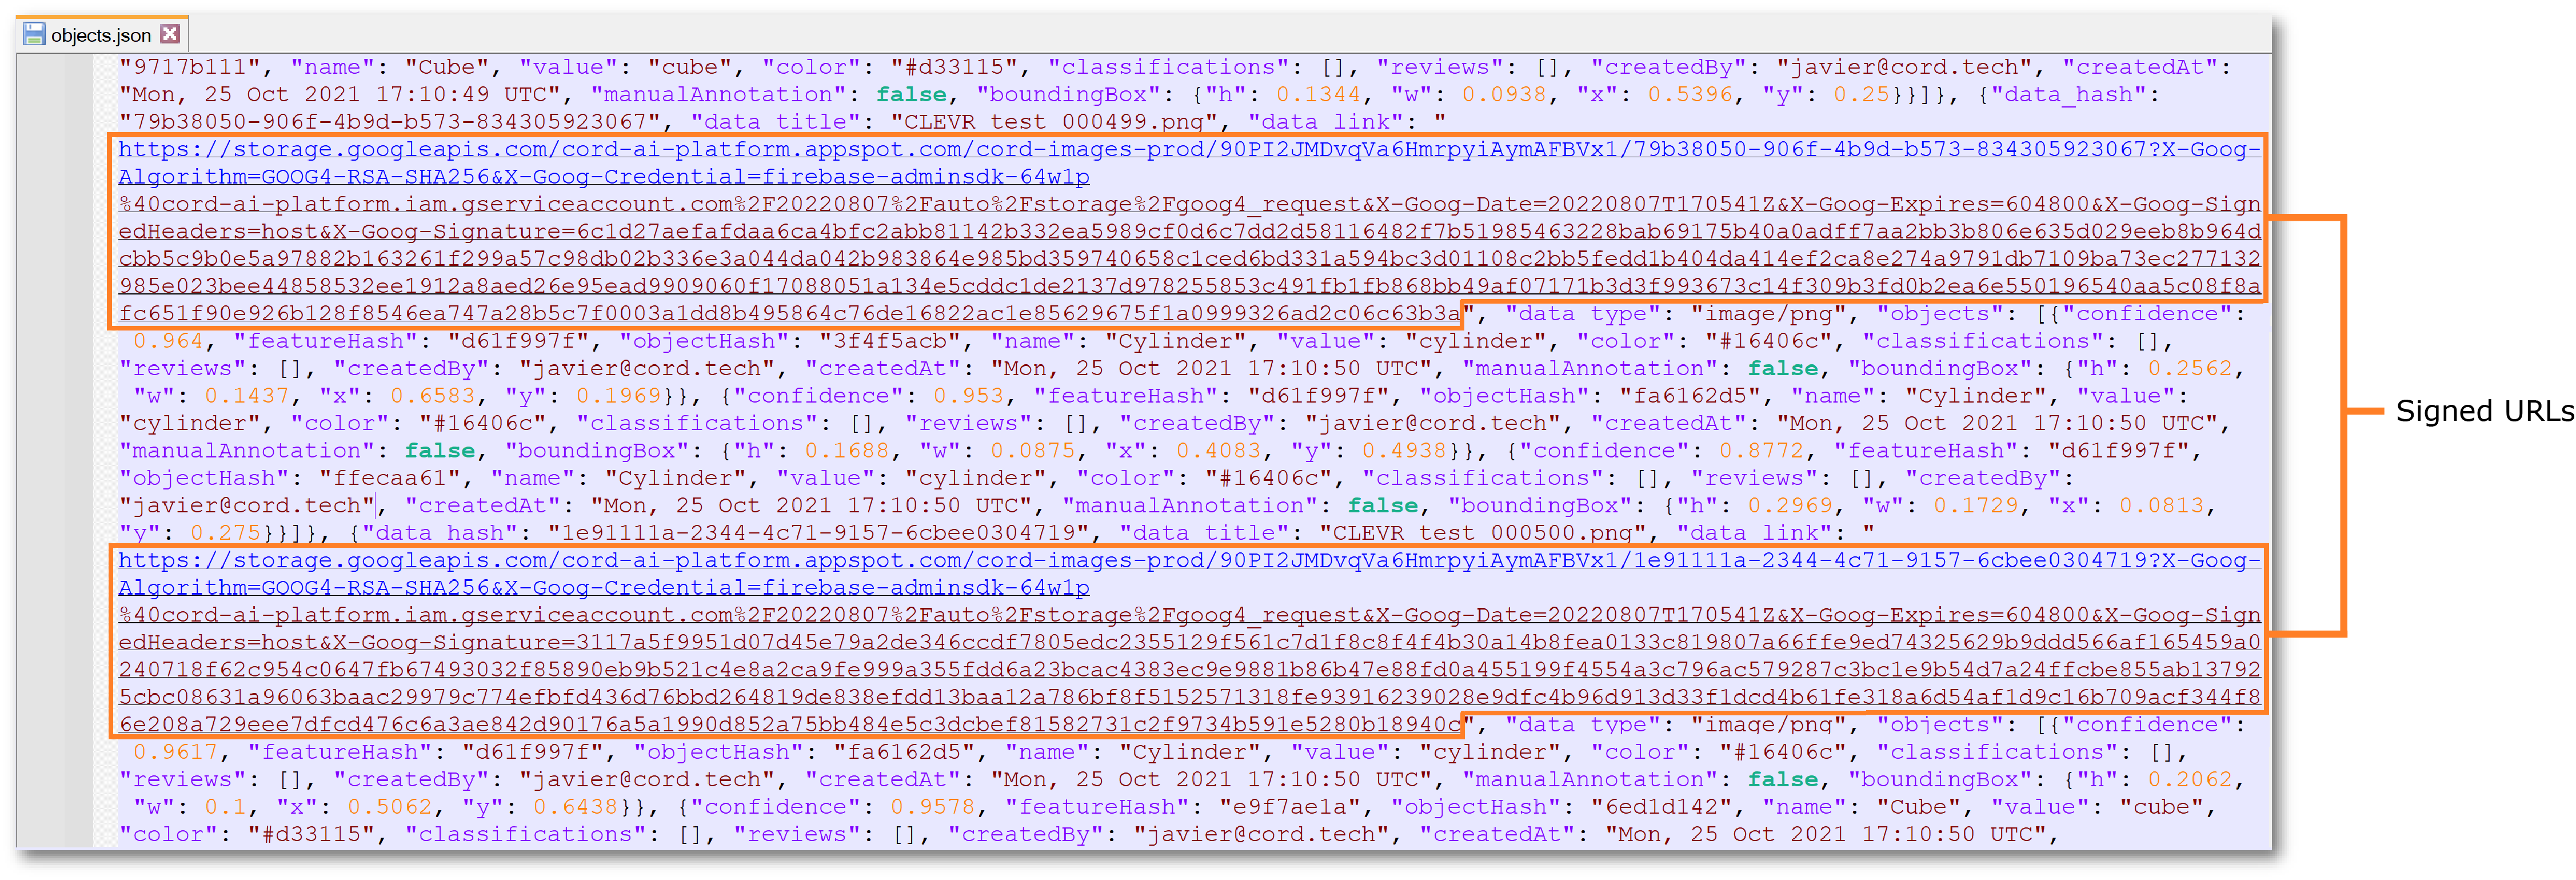
- Generate signed URLs: (JSON-only) Turn on the toggle to generate signed URLs to allow the exported JSON files to open a data asset directly in the browser. Keep in the mind the labels are not available on the data asset, instead it's only the data asset as it was originally uploaded. Click and follow the link under the "data_link" attribute to view a signed URL:
- (JSON-only) Use the Configure data section to select the objects and classifications to include in the export.
- The Export labels allows you to choose which assets to export labels from. Data assets that have polyline annotations in it are currently not supported in the COCO format.
The export button will queue the export process. Depending on the number of labels, the process queue may require a few minutes. Monitor the Activity menu in the upper right which will inform you of when the export is ready for download. Download files are tagged with a unique id for the project they're exported from and the time at which the export is made -- so there are no worries about previous downloads being overwritten by new exports.
Label export history
Export history is tracked per file per request, regardless if the request was made via the web app or the SDK,
or if the format was COCO or Encord's JSON format. Currently, you can confirm the export history for a given
file by exporting it from the web app in Encord's JSON format. Export the labels like normal and look for the
export_history key inside each label object. Note that the act of exporting labels to confirm export history
will also generate an export history entry.
Export data from the Python SDK
Look here to learn how to export JSON files from Encord's Python SDK. Please reach out to us to request for exporting COCO labels.
Settings
The 'Settings' tab allows you to make modifications to your project using the following tabs:
- Options - Copy a project, modify datasets, modify ontology, upload annotation instructions, modify project tags, QA settings.
- Team - Manage collaborators on a project.
- Danger zone - Delete your project.
Options
Copy a project, modify datasets, modify ontology, upload annotation instructions, modify project tags, QA settings.
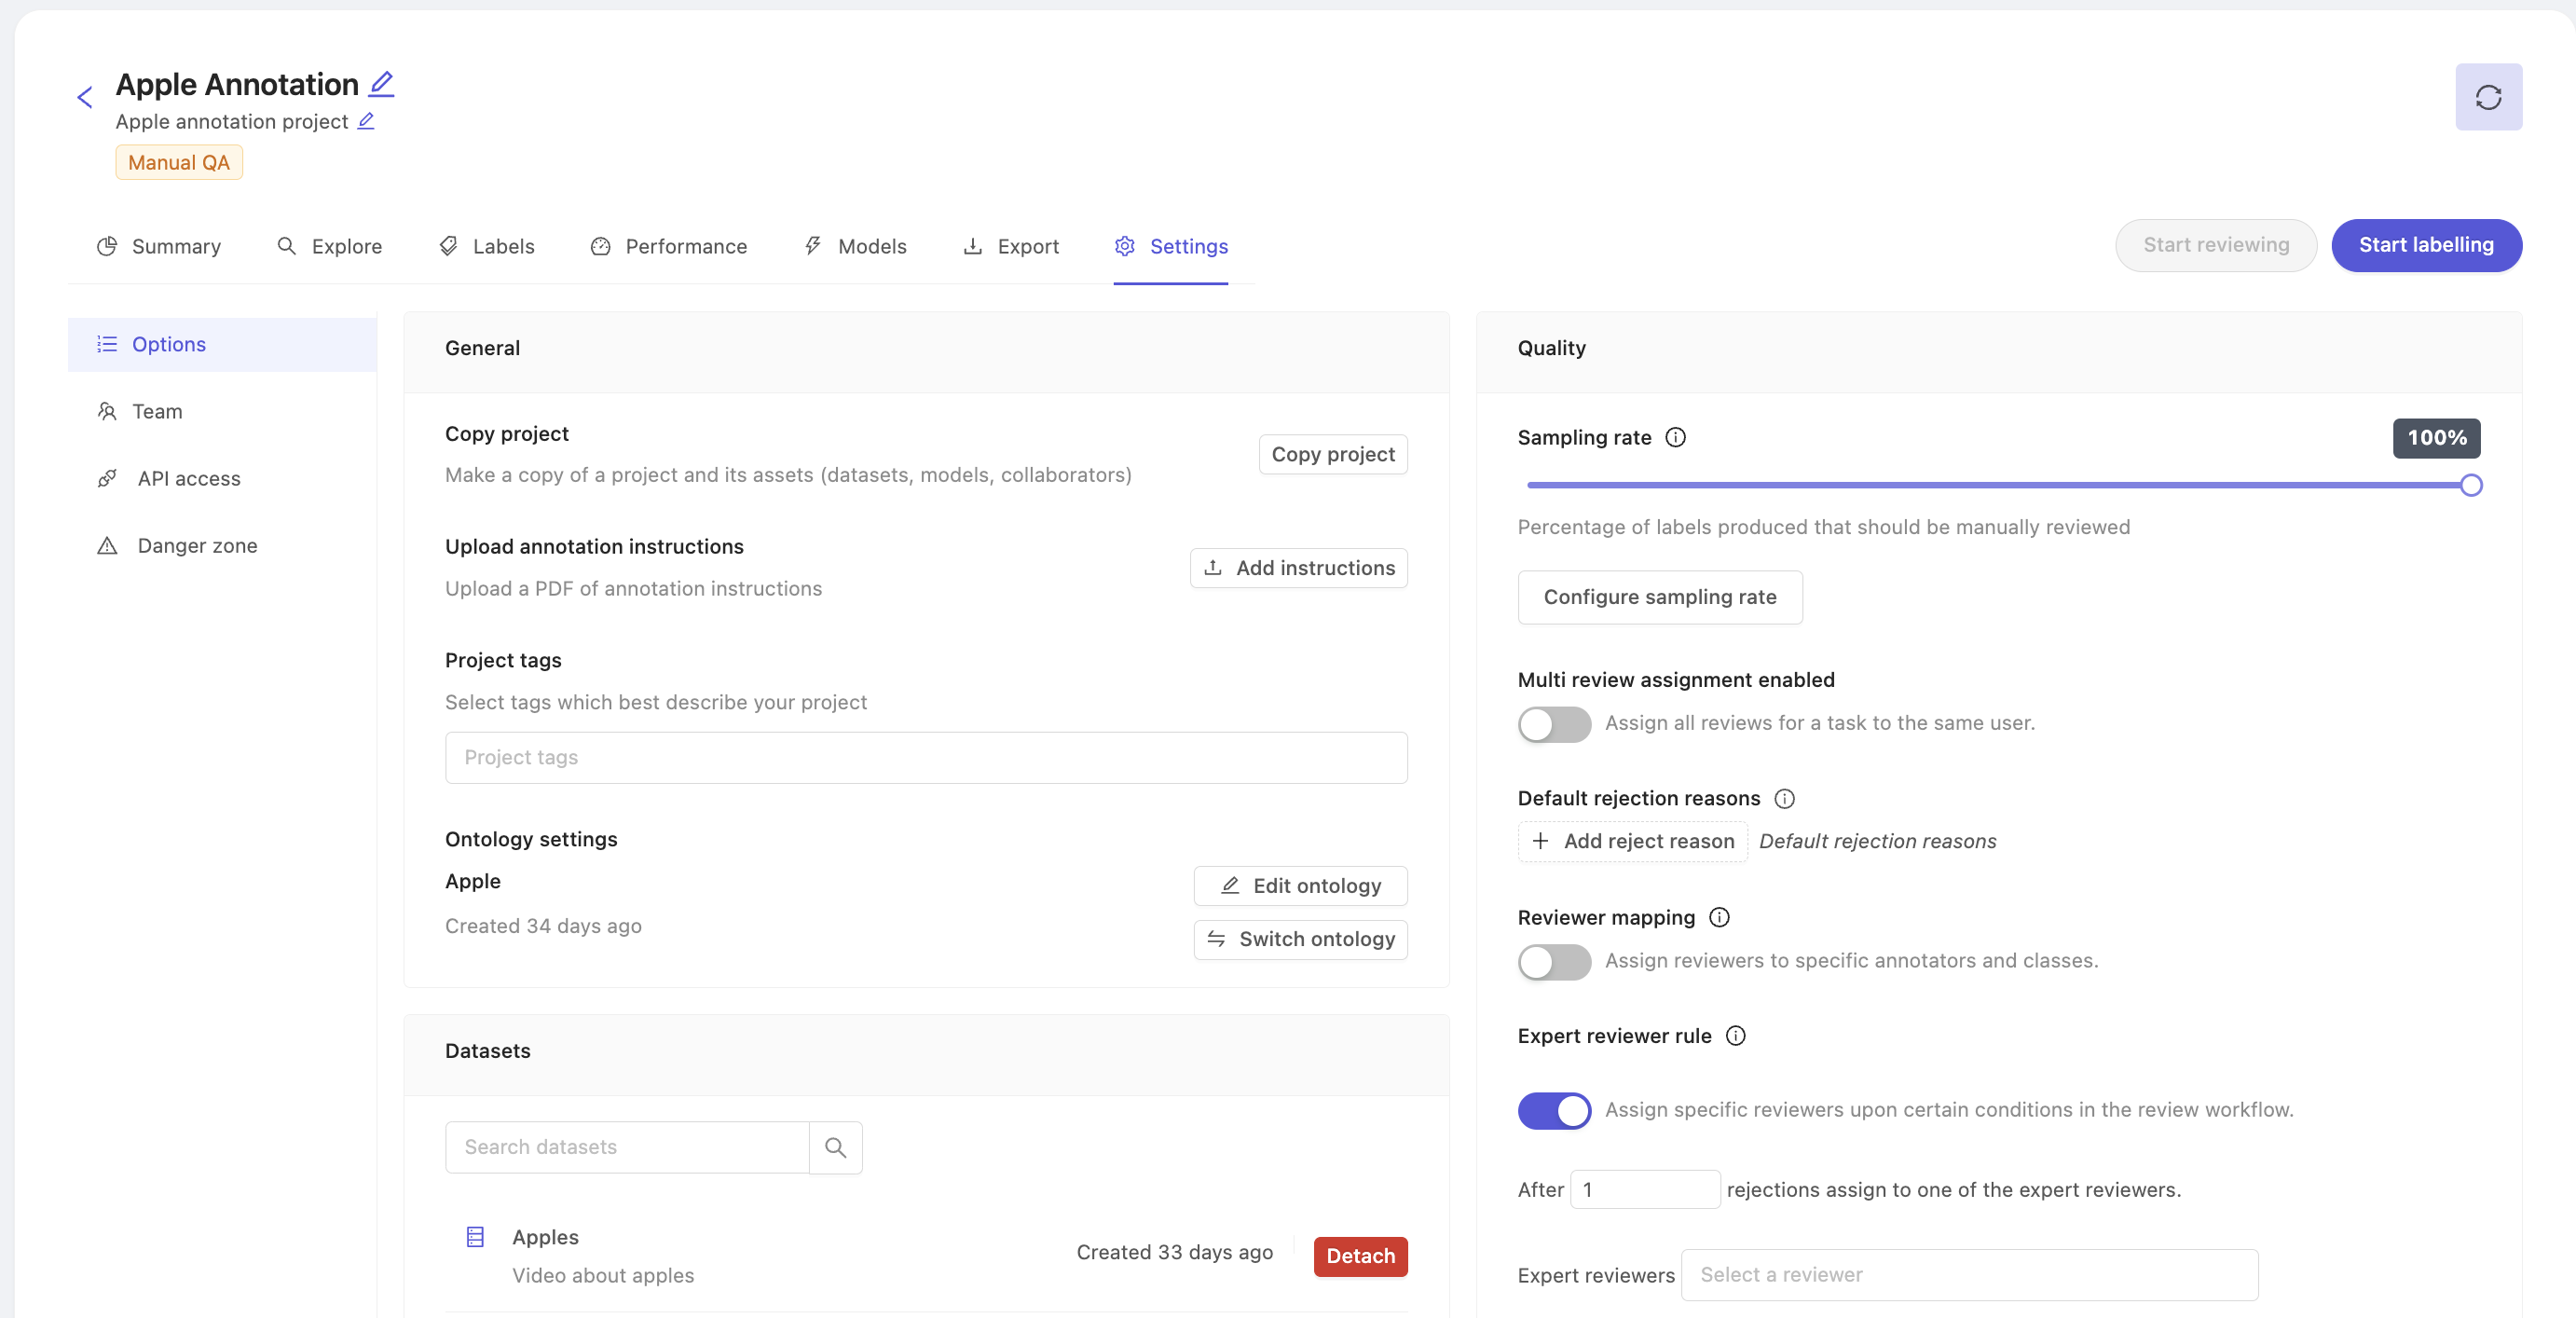
Copy a project
To copy a project, click on the Copy project button in the 'Options' tab under 'Settings'. This will open the copy project window, where you can pick the various parts of your project you want to copy over into your new project.
1. Select copy options
Choose the parts of your project you want to copy.
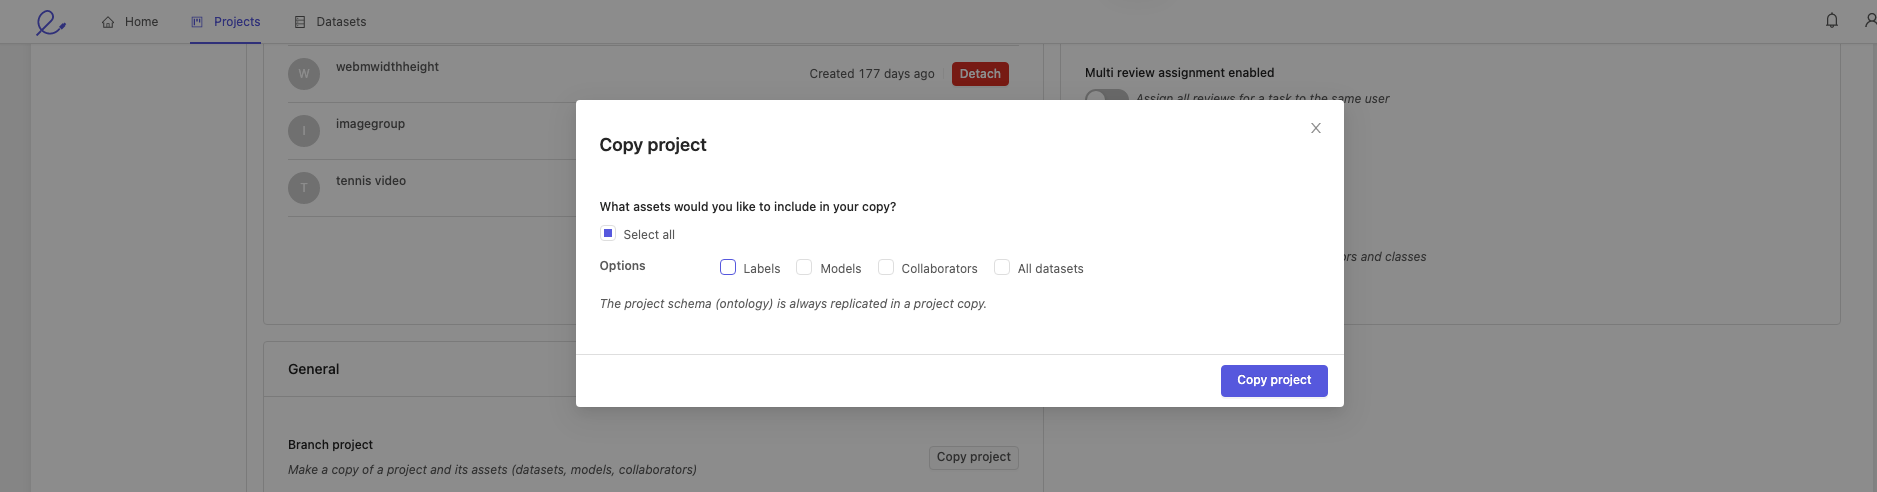
You can copy any combination of the following assets:
- Labels: this will copy the labels within videos and image groups of your choice.
- Models: this will copy all the models in your project along with their training logs.
- Collaborators: copy all project users with their respective roles. Project admins are copied regardless of whether this is selected or not.
- All datasets: all datasets will be copied, and new annotation tasks will be created for all videos and image groups if their labels were not copied over (see next line).
The new annotation project will use the same ontology as the original. This can be changed in the project settings if required.
If you don't want to copy labels, press Copy project. This will create the copy of your project, which you can then access in the 'Projects' tab.
If you choose to copy over labels, you will be asked to select the data assets for which you would like labels copied over. To begin the process, press Next: configure labels. Continue to step 2. below.
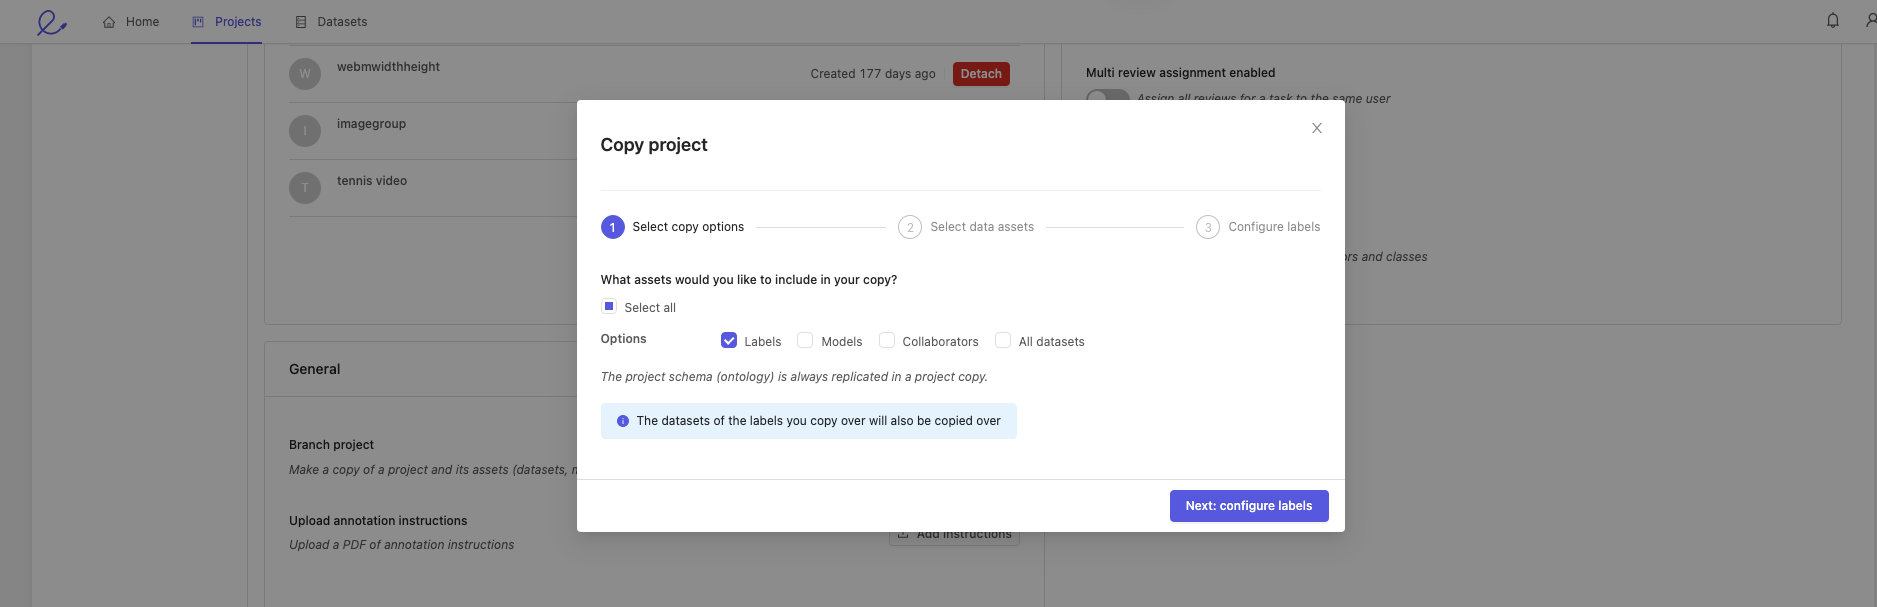
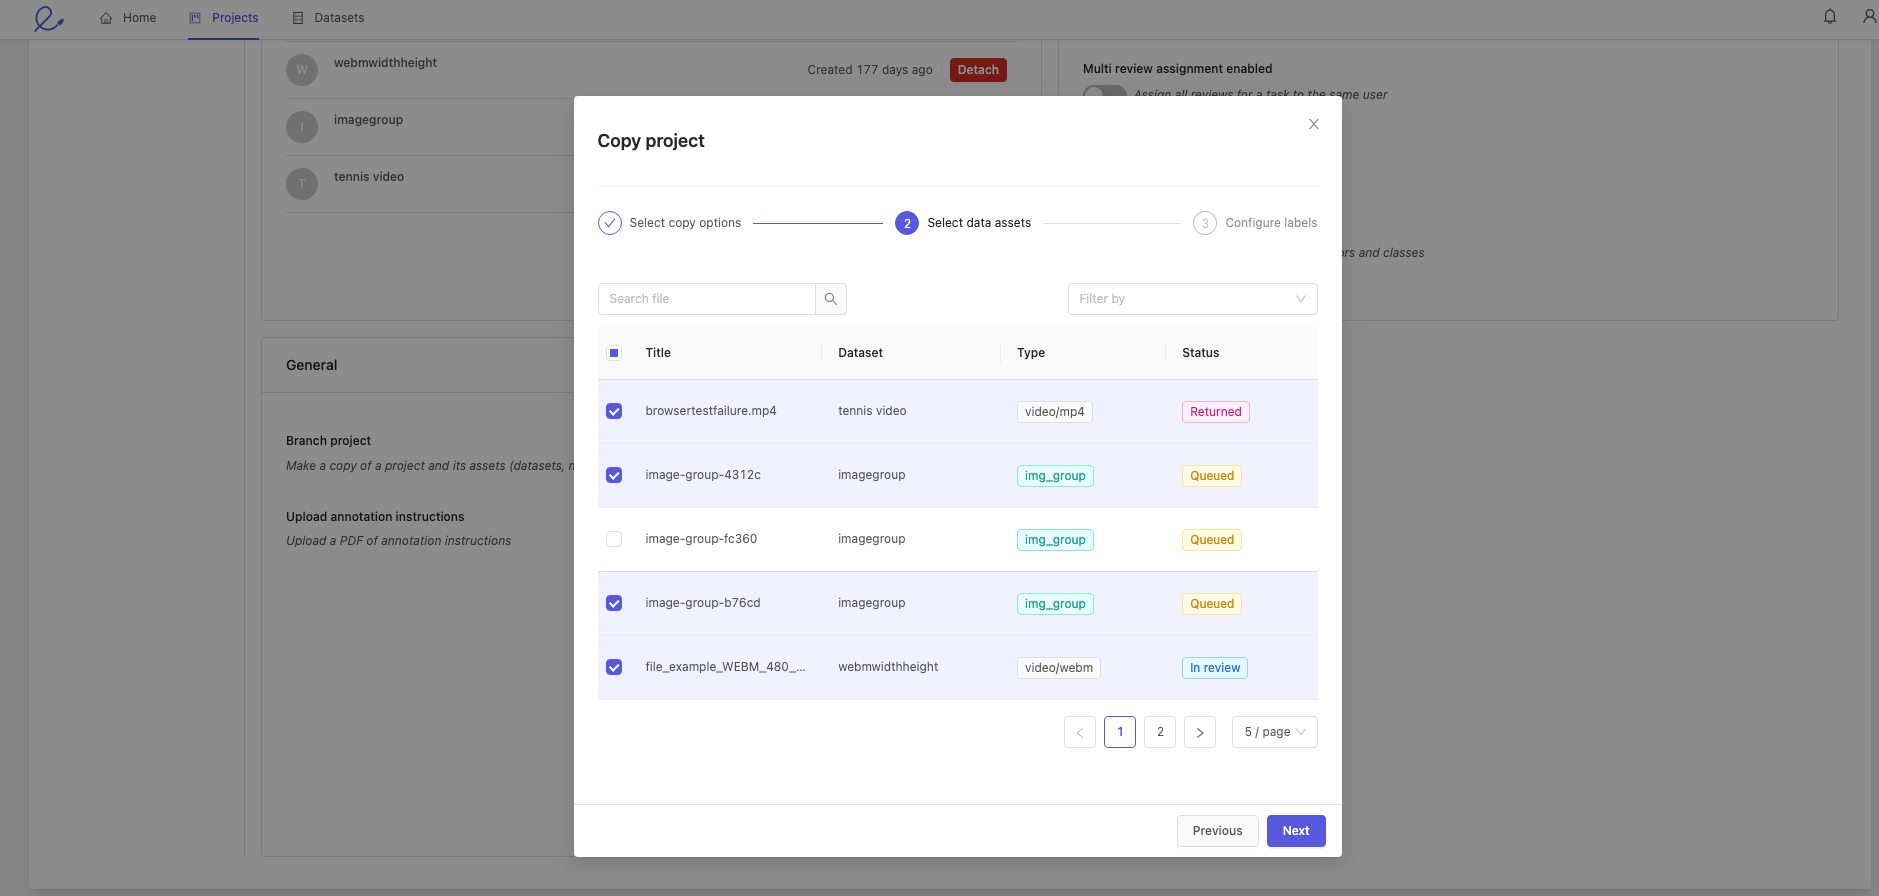
2. Select data assets
Select the files whose labels you want to copy over. After doing so, click Next.
3. Configure labels
Select the statuses of the files you want copied over into your new project.
When a project is copied, the task status will not be copied.
This means that all tasks will be Annotate tasks, and their status will be Queued.
All tasks will have to be re-assigned after being copied.
Click the Copy project button to complete the process.
Upload annotation instructions
Click the Add instructions button to upload instructions for your annotators in PDF format.
To ensure the best possible results, provide as much detail as possible about what you would like annotated and how precise bounding boxes should be drawn. For example, instead of saying 'person', consider defining what should constitute a person for your annotators - only a full person? A torso? Or should any part of a person in a frame be labeled as a 'person'?
The more specific your annotator instructions, the higher the chances that your annotators will perform well.
- Once uploaded, annotation instructions will be accessible within the Label Editor.

Project tags
Tags are created and managed on the Organization level. Once created they can be added to individual projects.
You can add tags to a project if you are part of an organization. Project tags allow you to:
Flexibly categorize and group your projects.
Filter your projects.
Adding and removing tags
You can add tags to your projects in:
When creating a project.
In the 'Settings' page of a project. This process is described below.
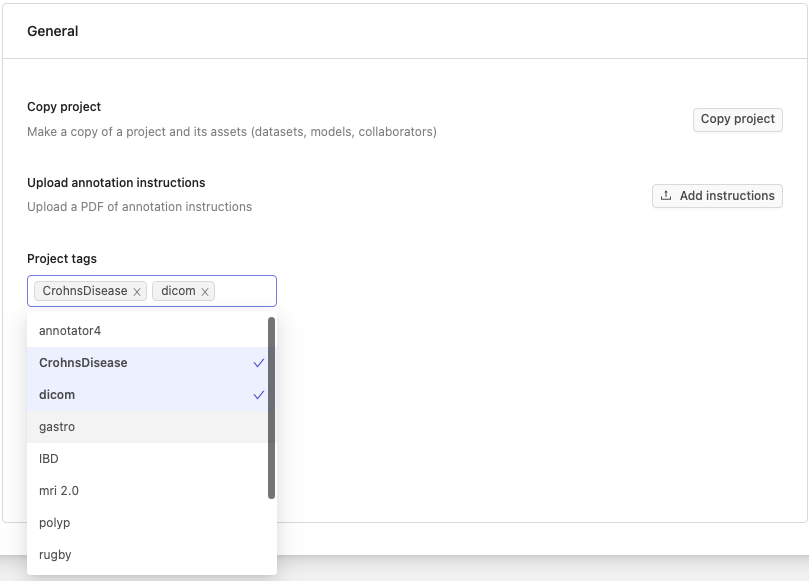
To add tags to your projects in the 'Settings' page, navigate to the 'Options' tab and click the 'Project tags' dropdown. Here you will see the available tags in your organization. Click on a tag to add it to a project. You can remove a tag from your project by clicking the same tag again, or clicking the x button next to its name.
Filtering projects by tags
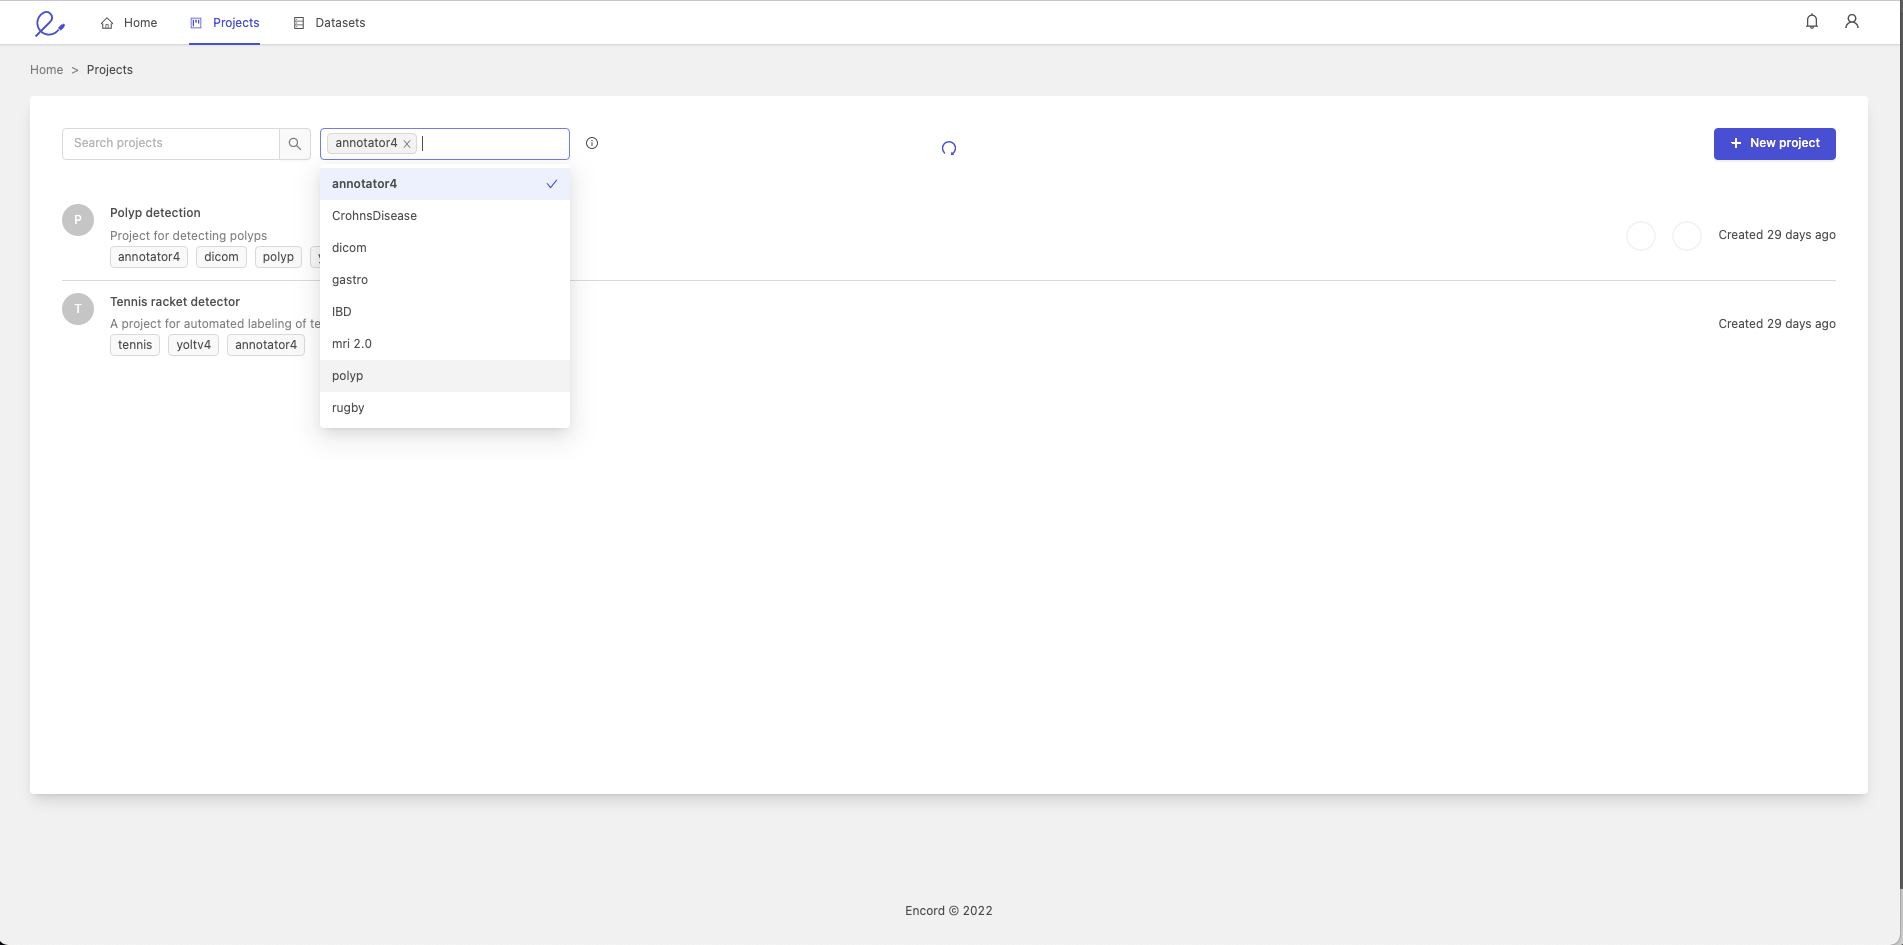
You can filter your projects based on the tags they contain. To do so, click on the 'Projects tab' in the Navigation bar, click the 'Filter by tags' dropdown and select one or more project tags. This will result in only projects with the tags being selected being displayed.
Edit project ontology
You can view or switch the ontology attached to your project.
Changing the ontology can render existing labels invalid and lead to data inconsistency.
Click the Switch ontology button to switch the ontology linked to your project. The resulting pop-up allows you to choose an existing ontology from a list, or create a new ontology for this project.
Click the View ontology button to view the details of the ontology that is attached to the current project.
Edit datasets attached to a project
The 'Datasets' section allows you to attach or detach any number of datasets to your project. You will have to create a new dataset in the 'Datasets' section for it to become available in a project's settings.
Quality Assurance (Automated QA)
The 'Automatic QA' section in the 'Options' pane allows you to configure the way that quality assurance is implemented.
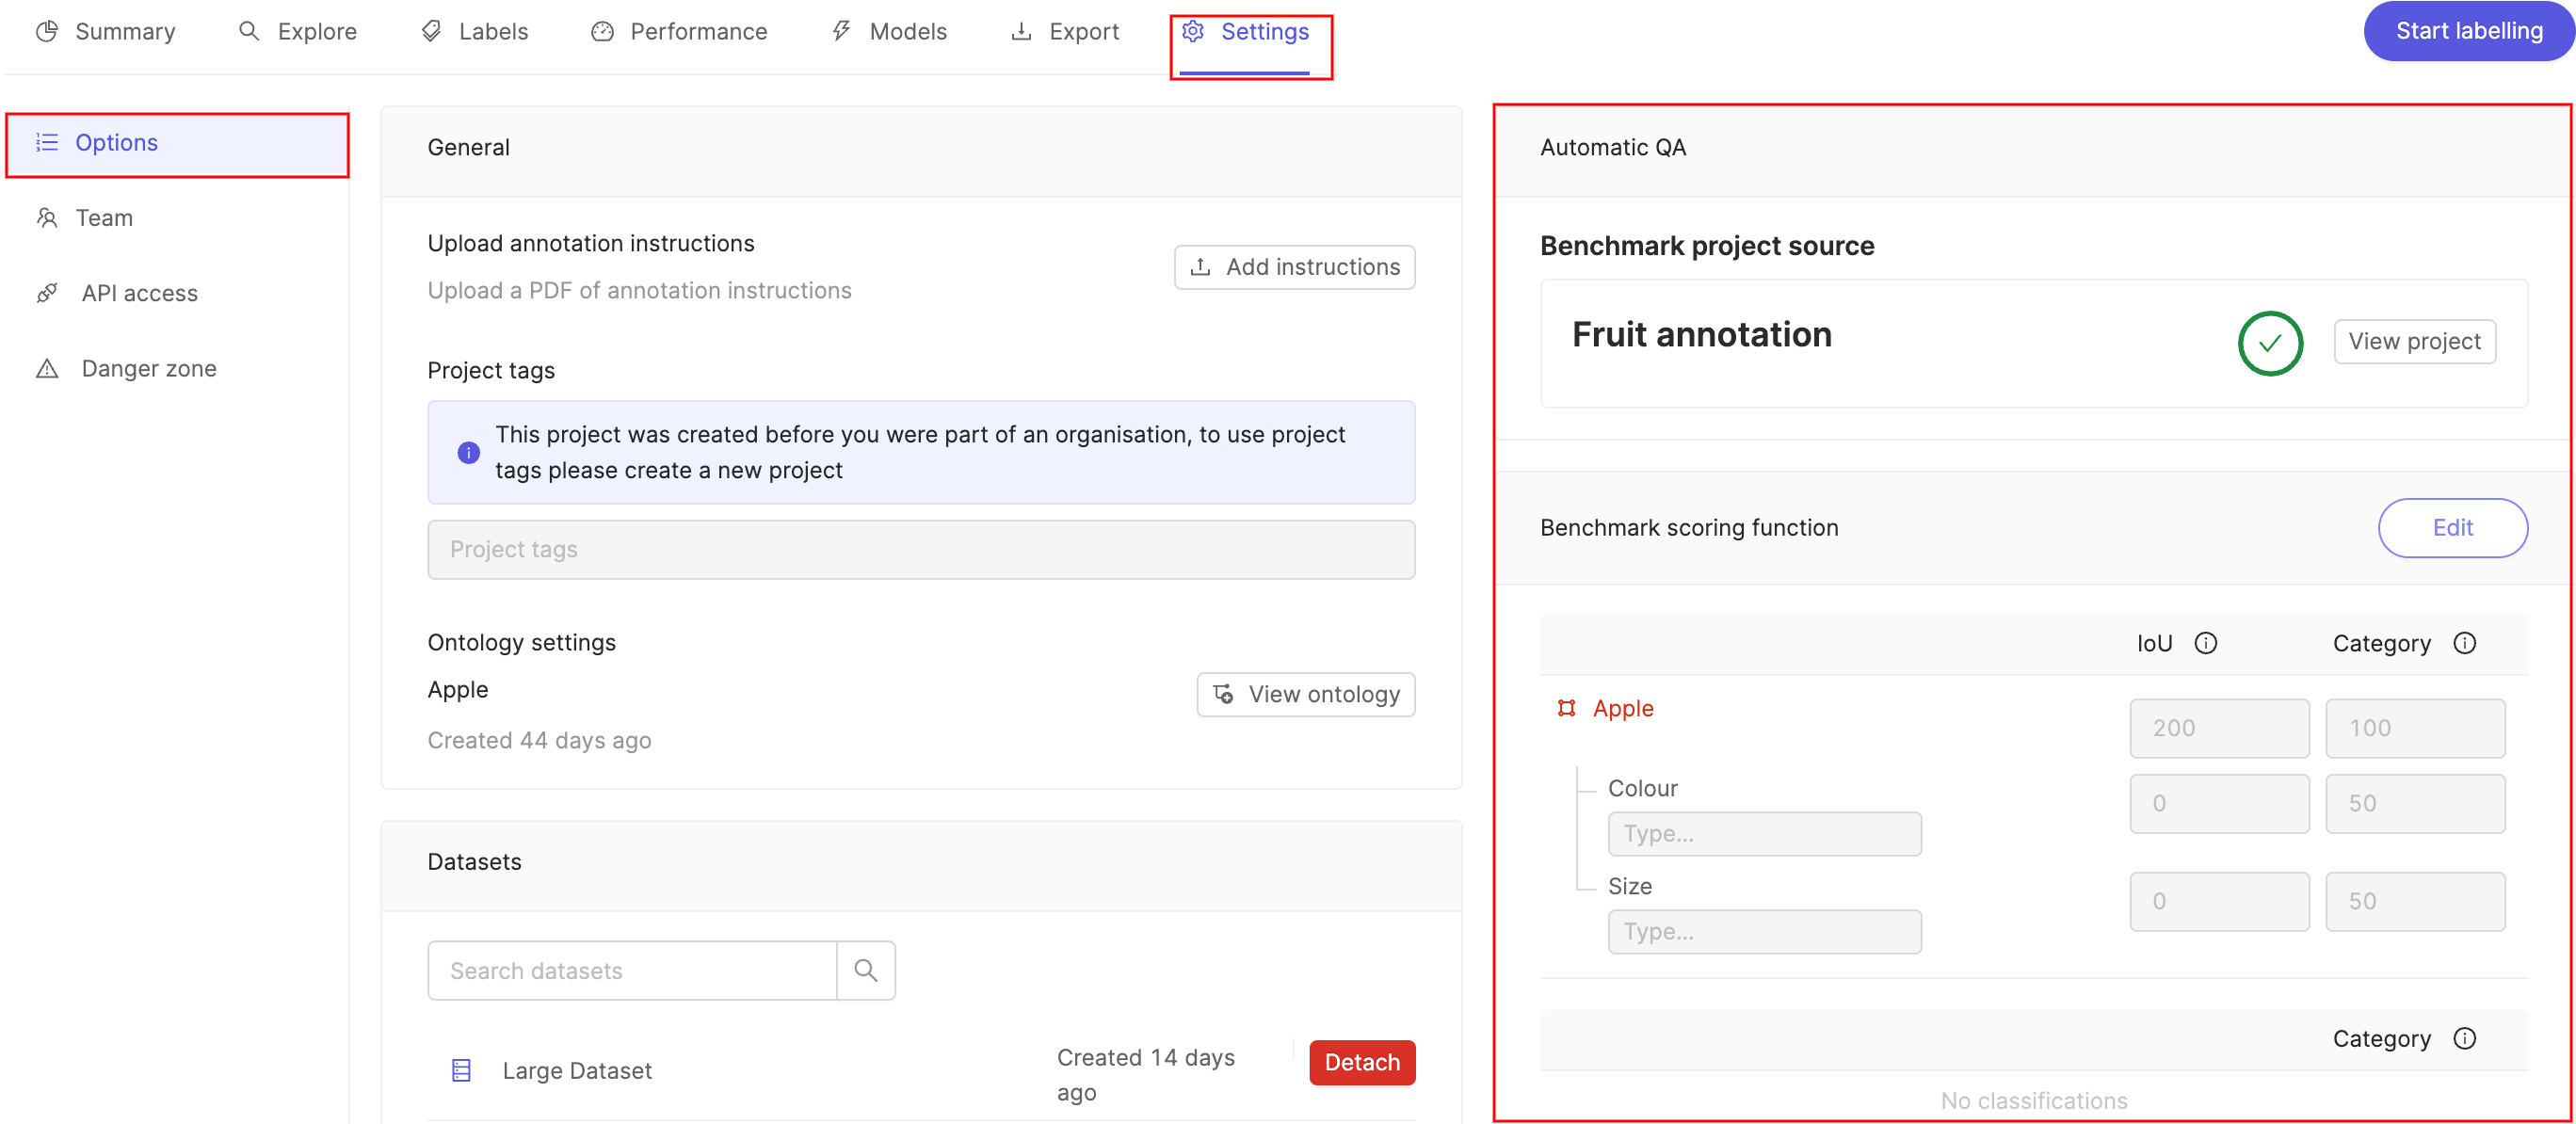
For a precise description of automated QA please see our automated QA documentation.
The Benchmark project source allows you to see which project is being used as the gold standard benchmark function against which QA is done.
Click Edit next to the Benchmark scoring function to adjust the relative weight of the IoU and Category evaluation metrics. Click Save when you are done.
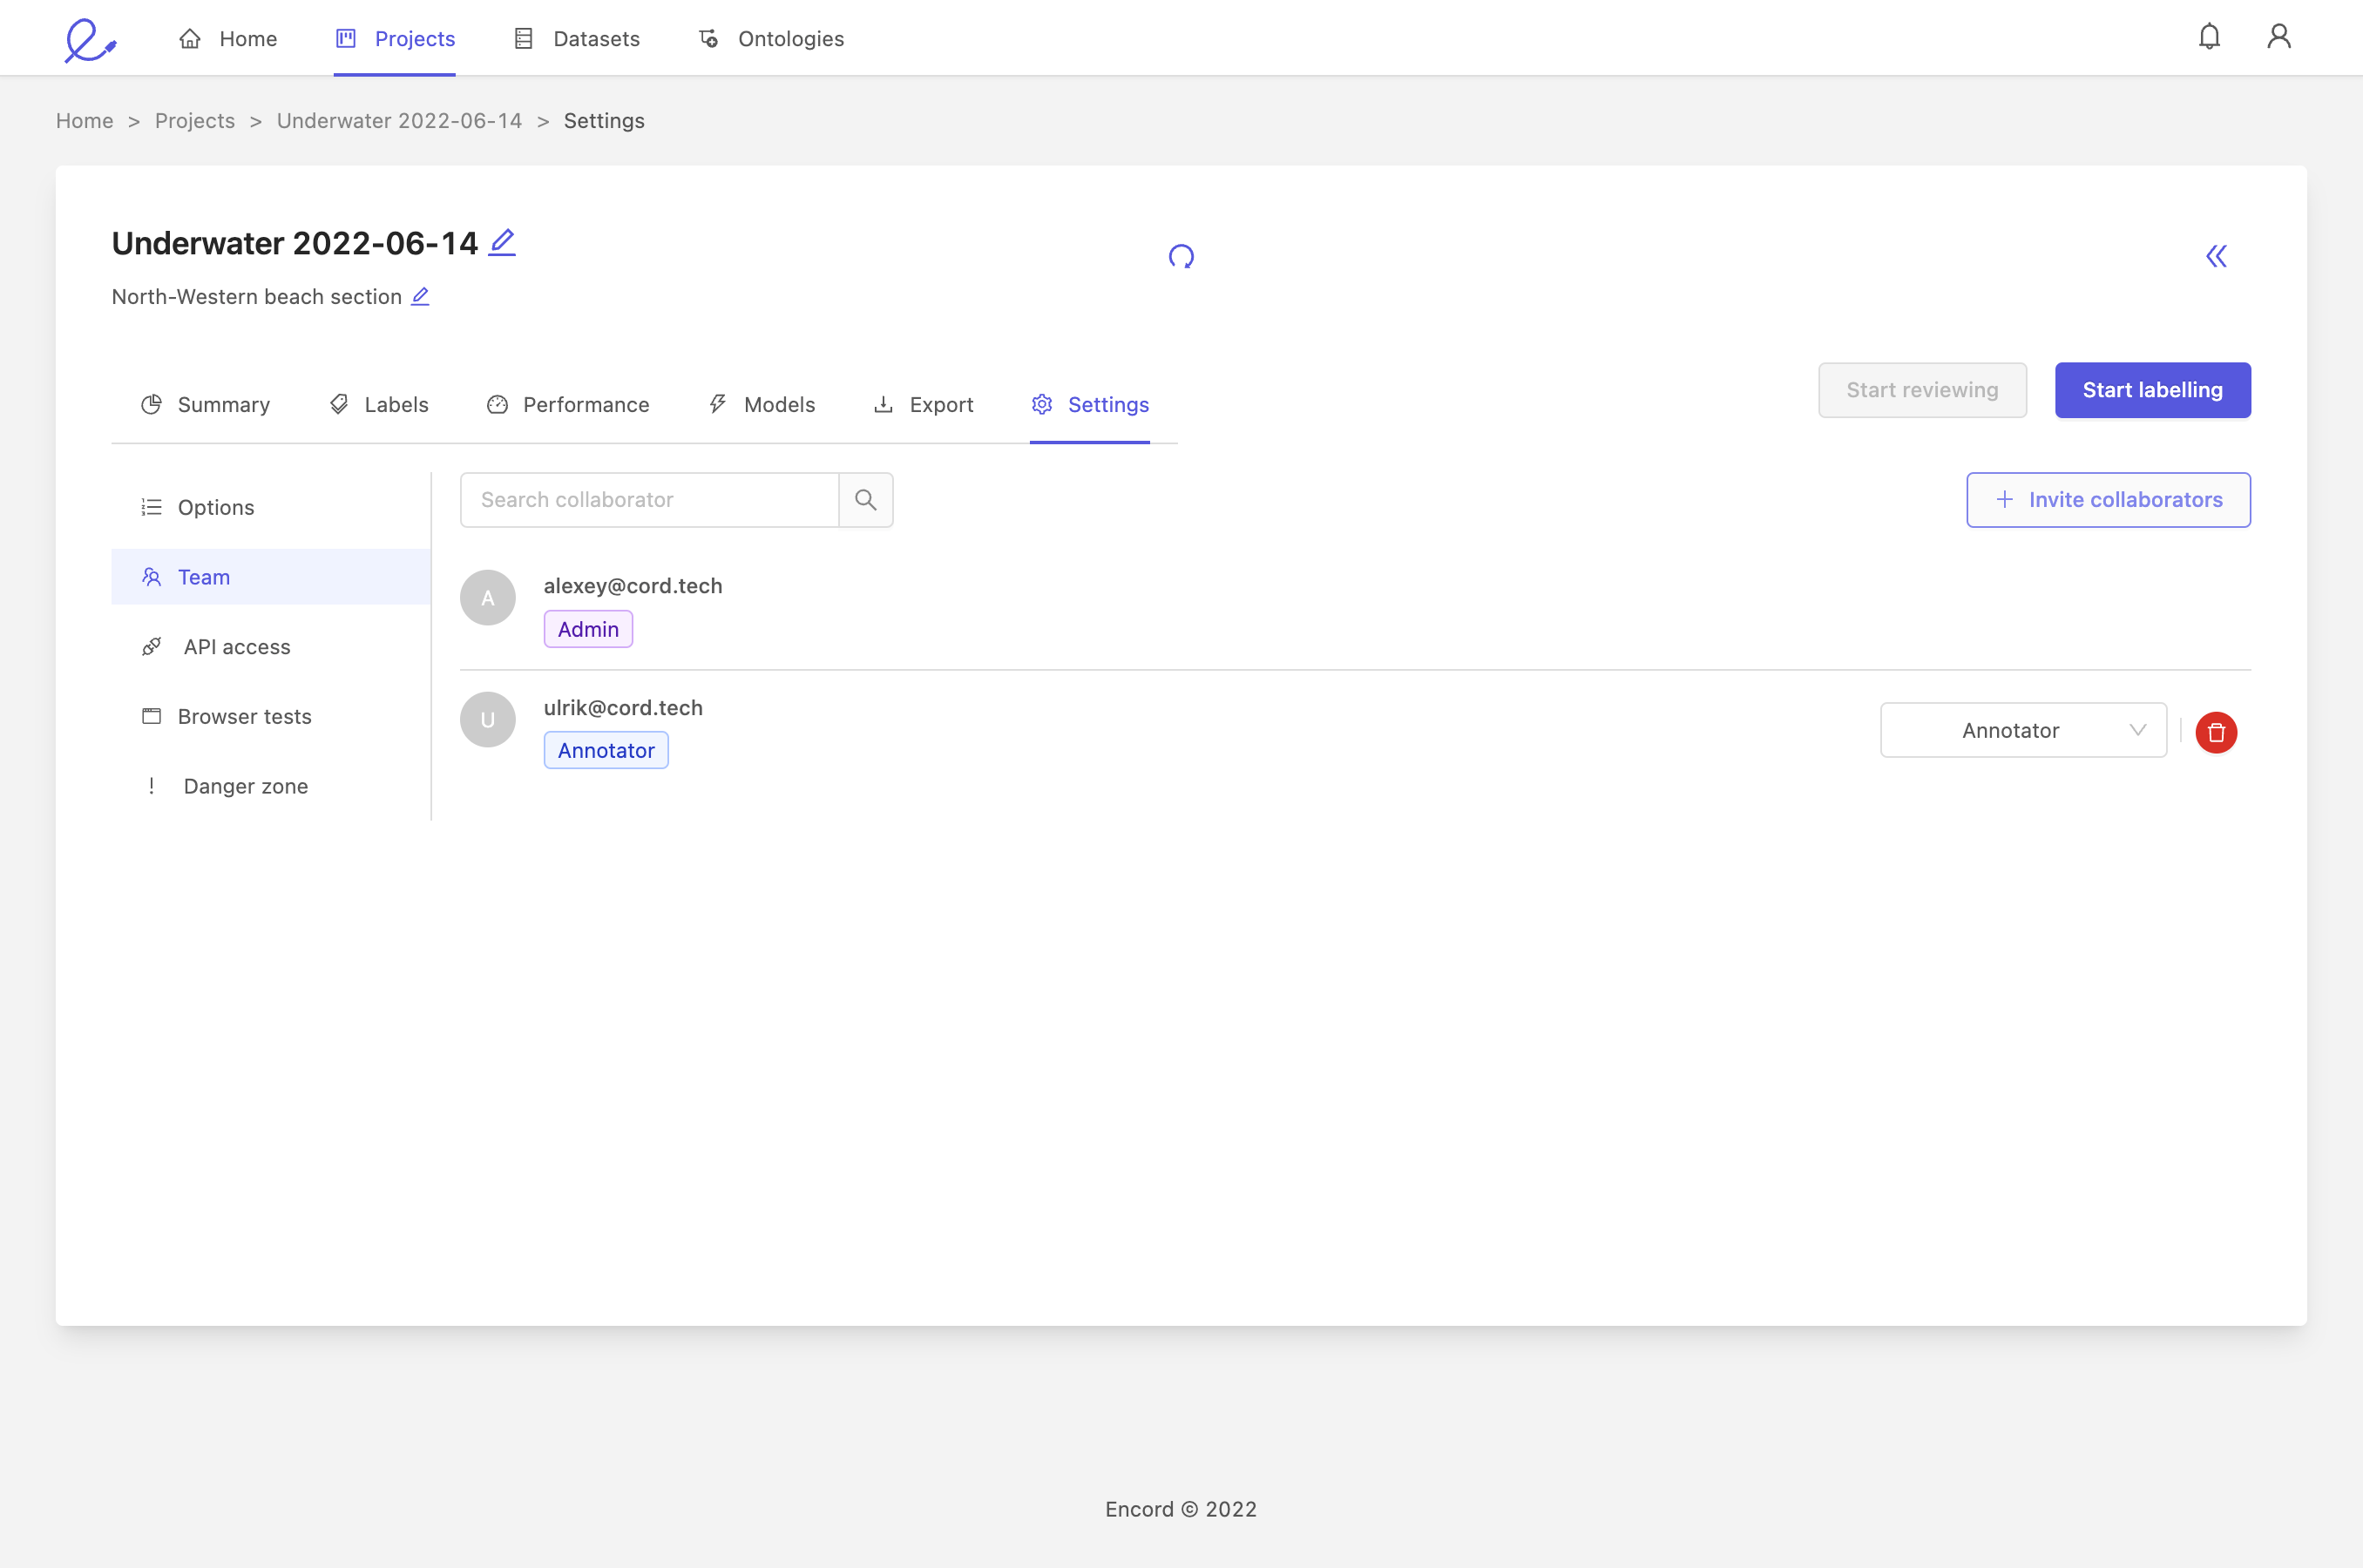
Team
To manage project collaborators, select the 'Team' pane in your project 'Settings'.
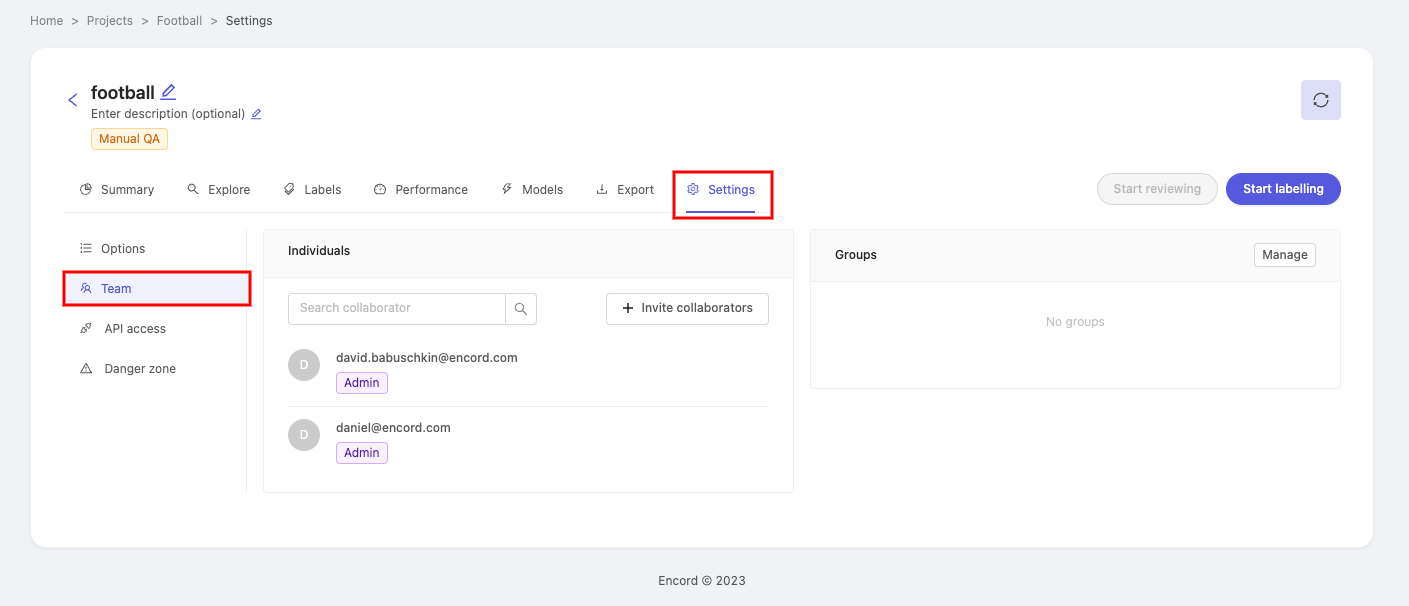
Here you can invite collaborators to the project, and configure their roles.
1. Add a collaborator
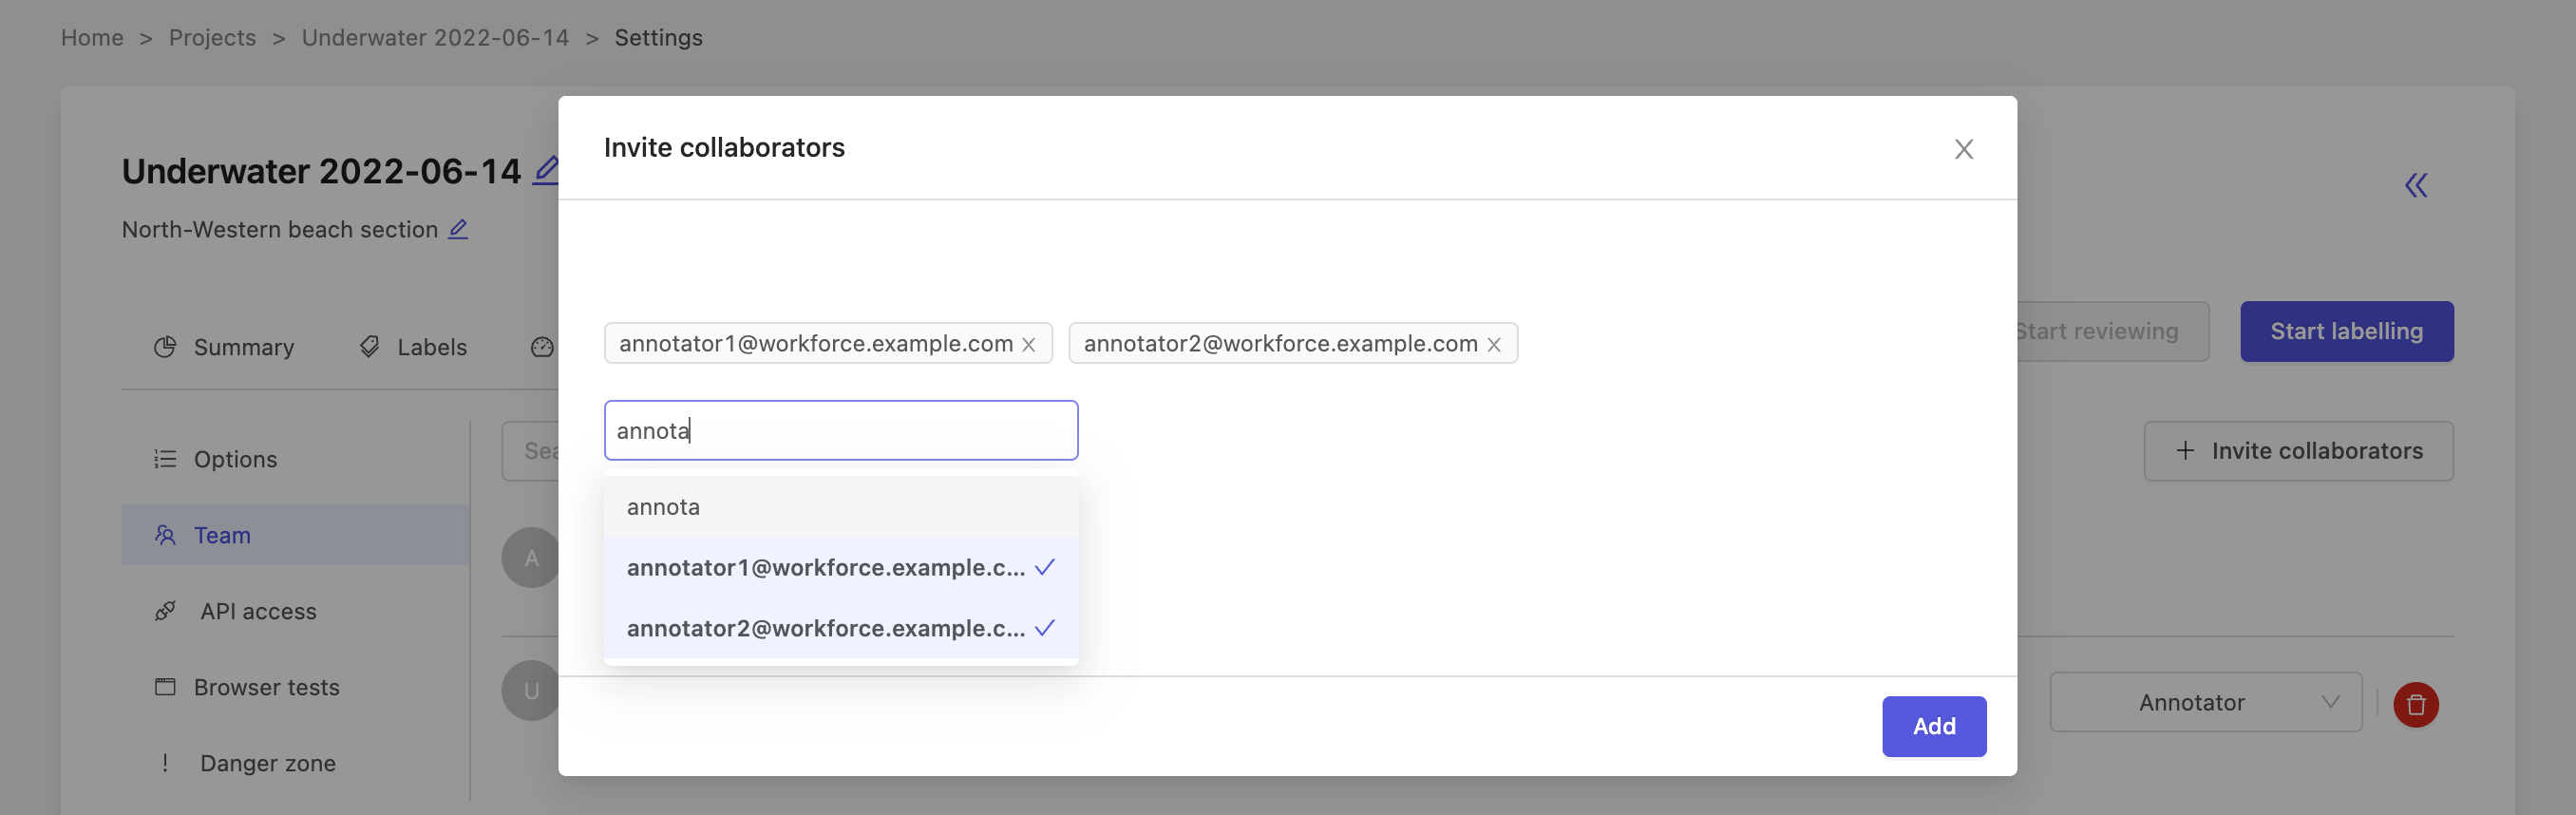
To invite collaborators to your project, click the + Invite collaborators button. This will open a new window where you can enter email addresses of the people you would like to invite.
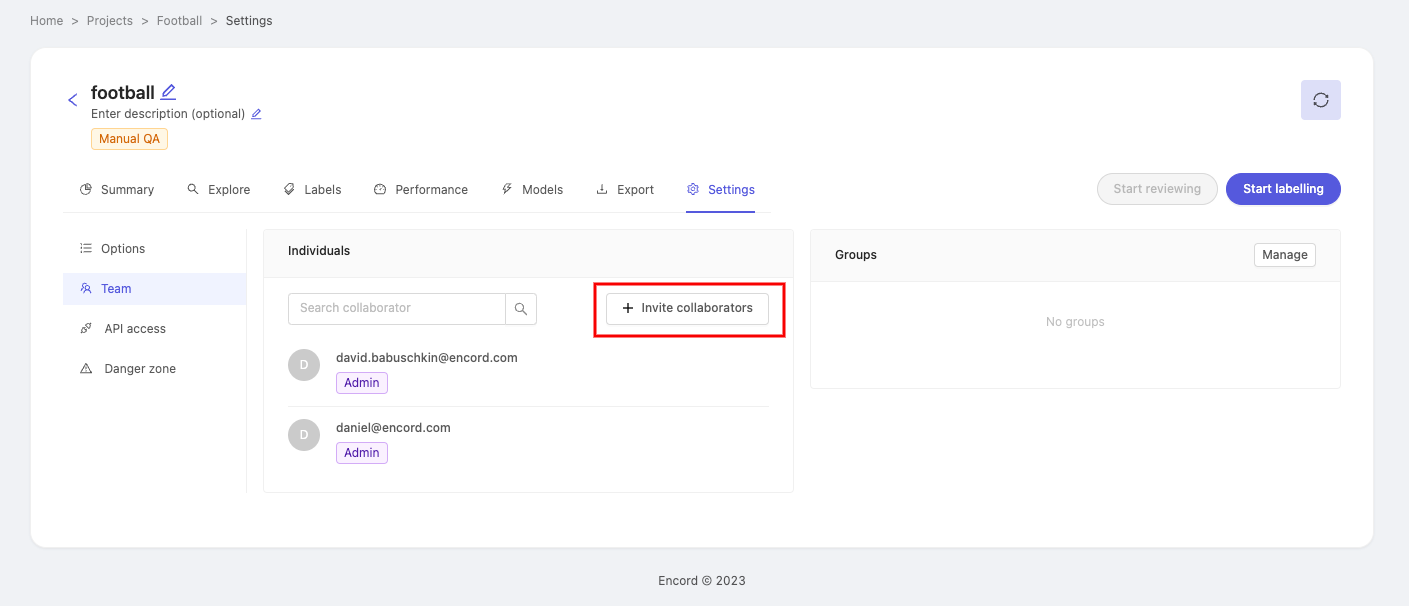
Once you have entered everybody you want to invite, press the Add button.
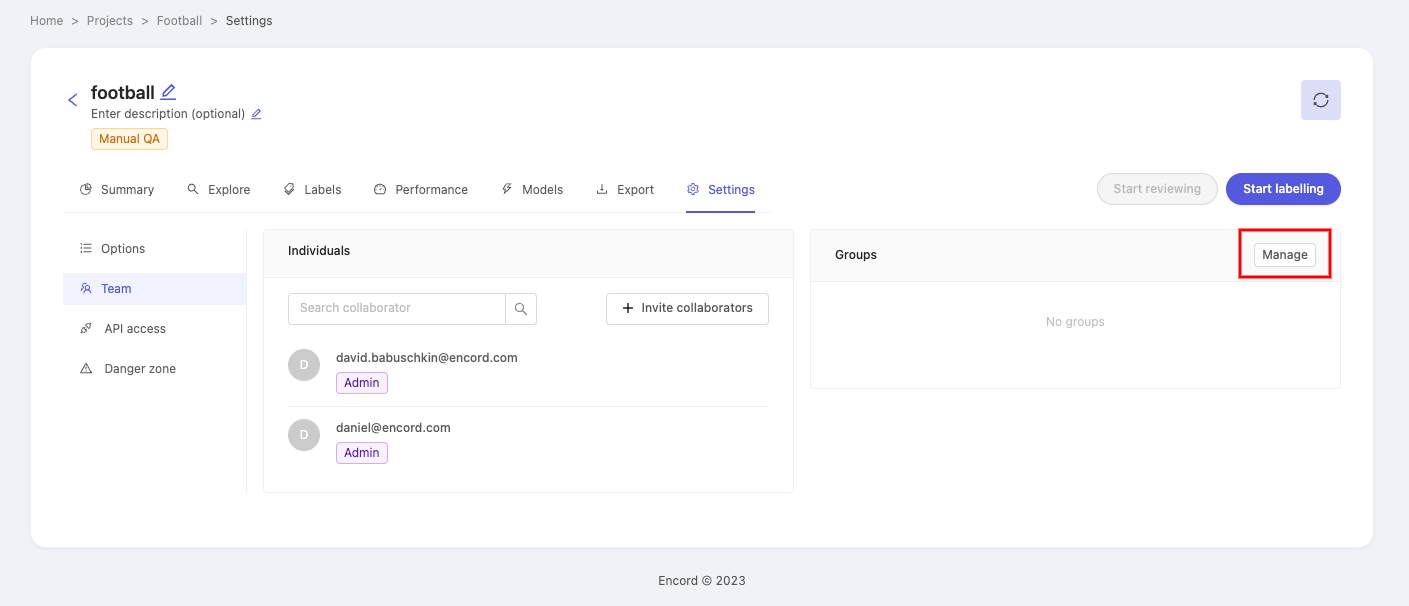
2. Add collaborators as a group
To add collaborators as a group, your organization needs to have user groups. Navigate to our documentation on creating user groups for more information.
Collaborators can be added to a project as a group - which can save time as well as ensure that no individual is forgotten.
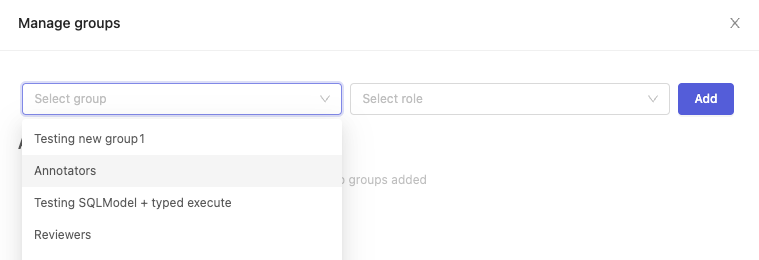
In the 'Groups' section of the page, click on Manage to make the 'Manage Groups' pop-up appear.
Click the 'Select group' dropdown and pick a group you would like to add as collaborators. After selecting a group, click the 'Select Role' dropdown to assign a role to the group of collaborators. Click Add to add the group.
The group you just added will appear under the 'Added groups' heading. Repeat the process if you'd like to add more groups with different roles to the project.
To delete a group from the project, simply click the ![]() button next to the group name.
button next to the group name.
2. Change collaborator role
A project admin can modify the different roles of collaborators, using the dropdown on the right.
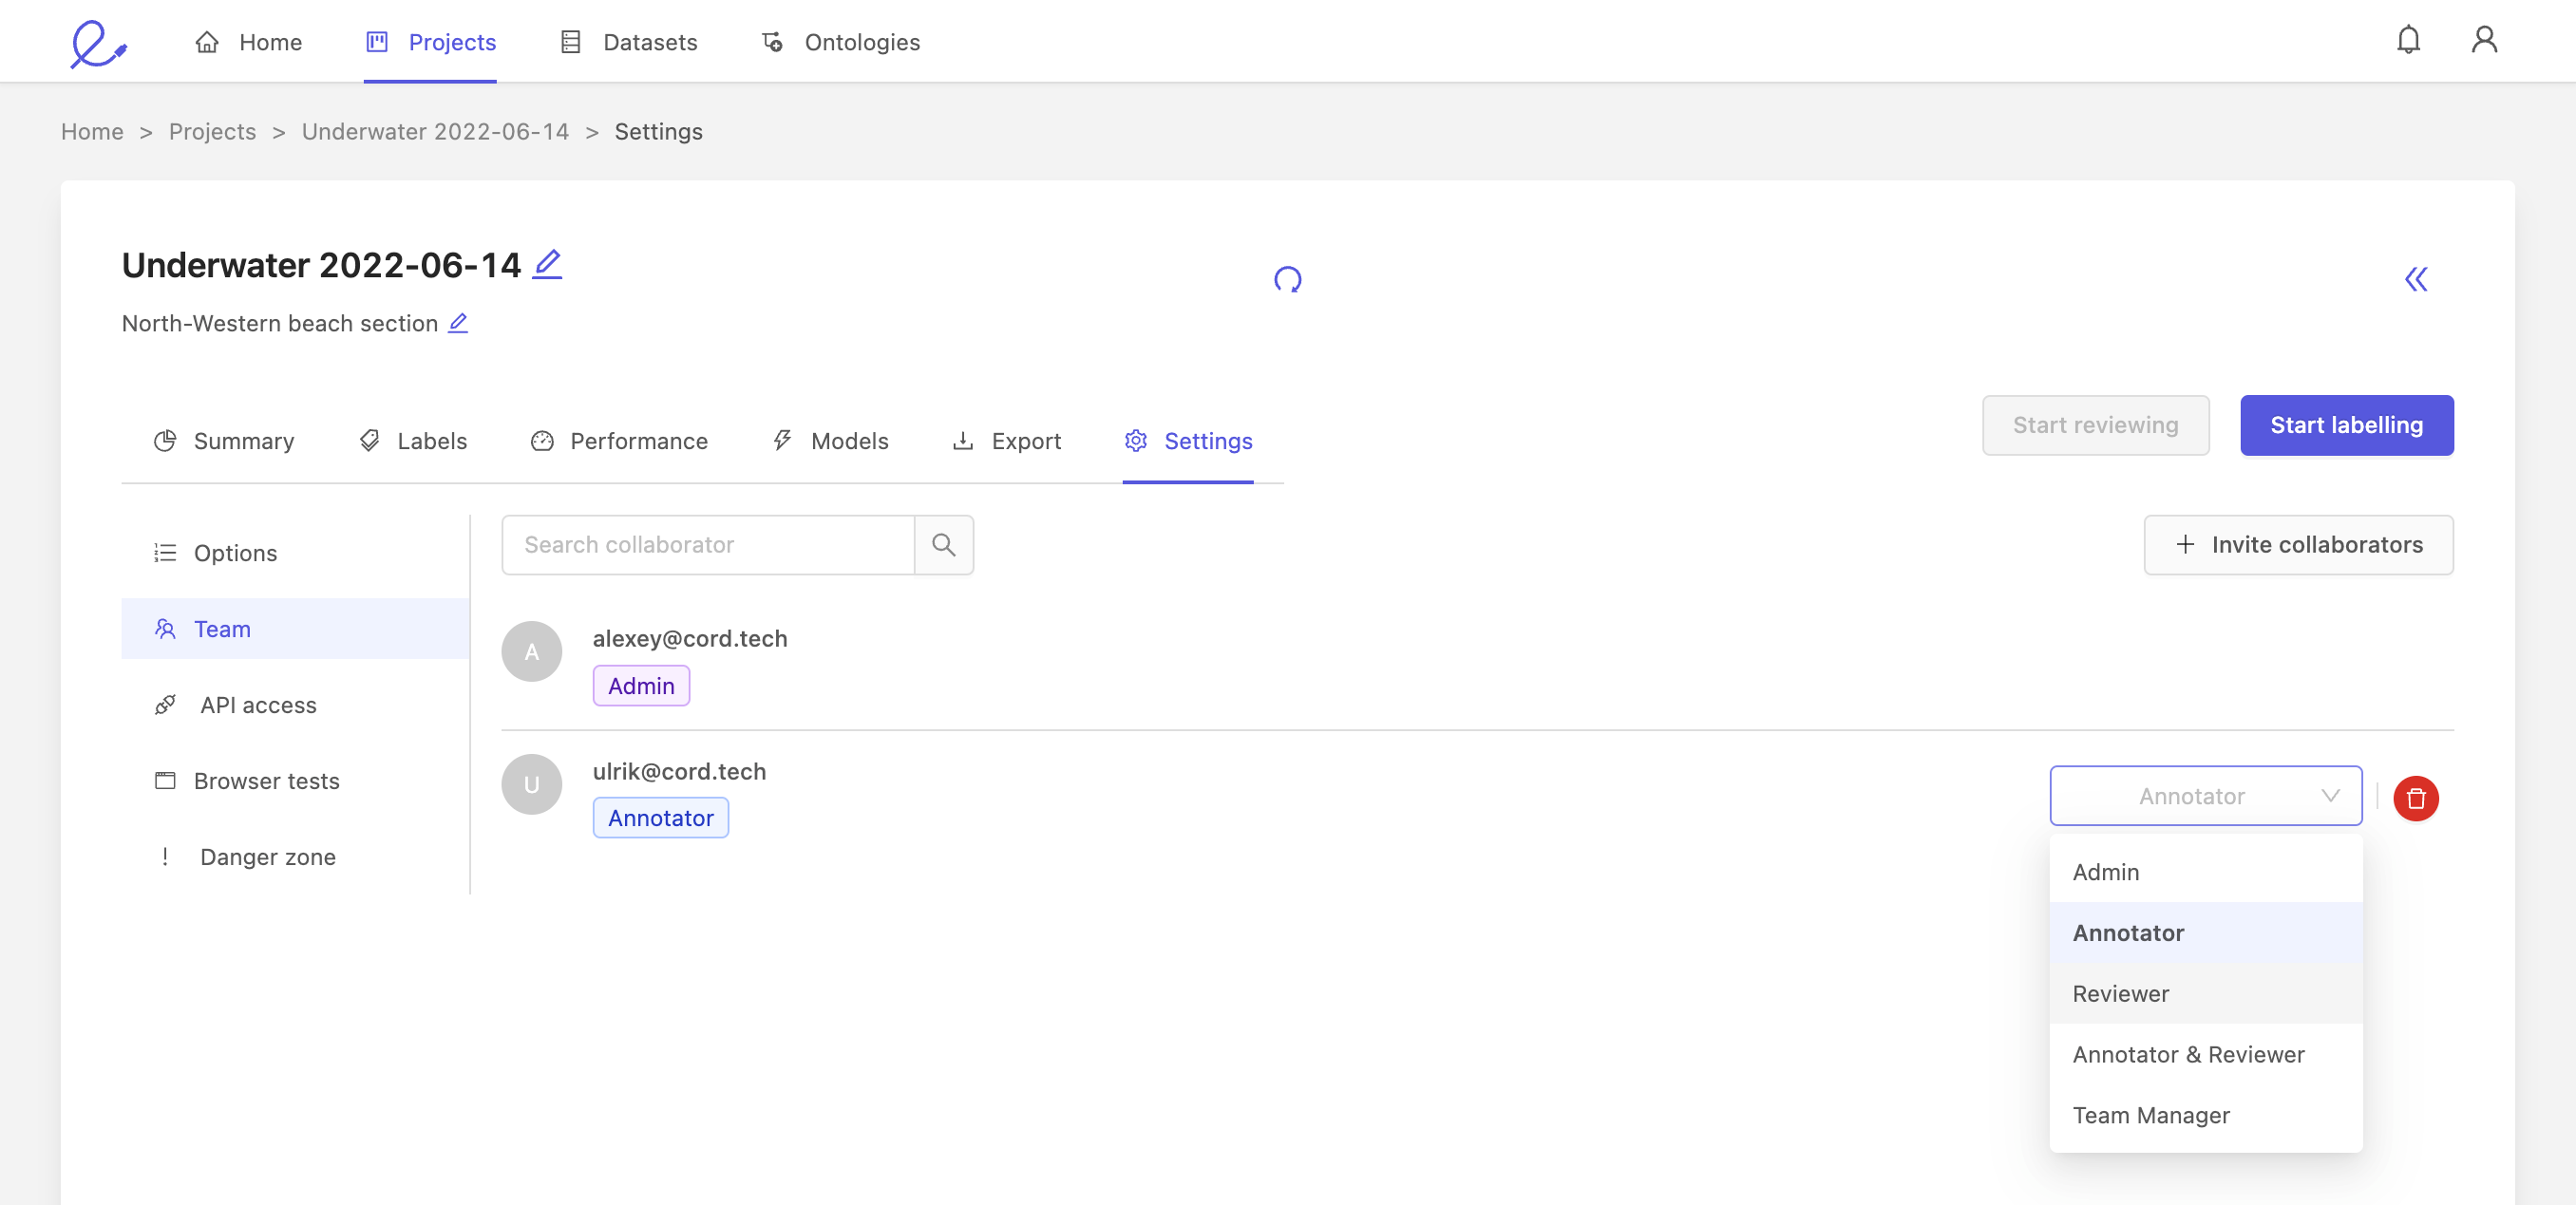
You can assign the following roles to collaborators:
- Annotator: annotators are responsible for labeling. This is the default role for all collaborators.
- Team manager: a team manager can assign tasks to other users, and add collaborators to the project.
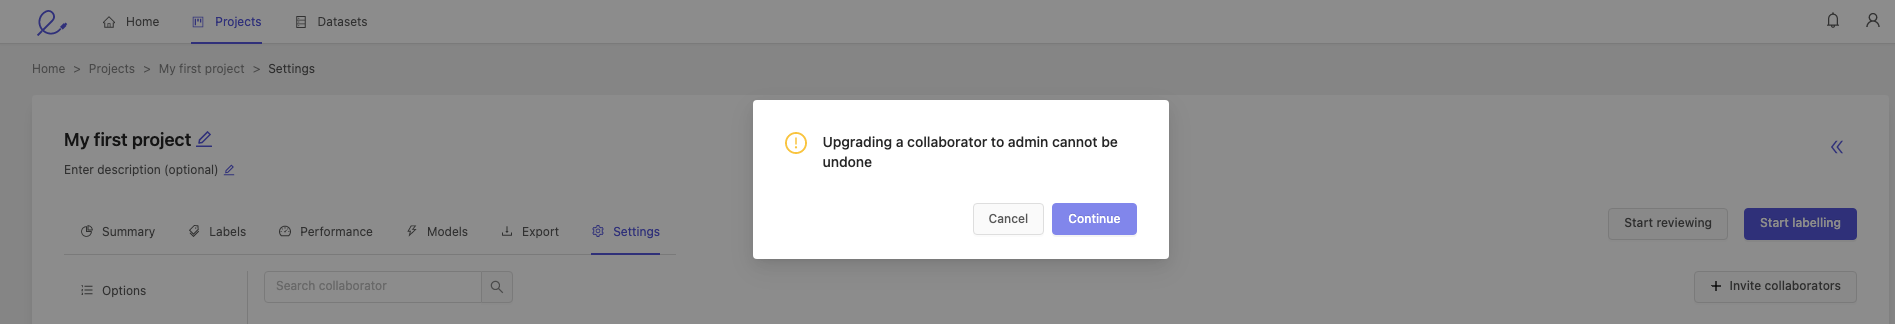
- Admin: gives this collaborator full administrative control over this project. Caution: this is an irreversible action.
Please confirm or cancel your selection when making a collaborator a project admin.
Danger zone
You can delete your project by going to the 'Danger zone' tab at the bottom of the menu, and clicking the red Delete project button, shown below.
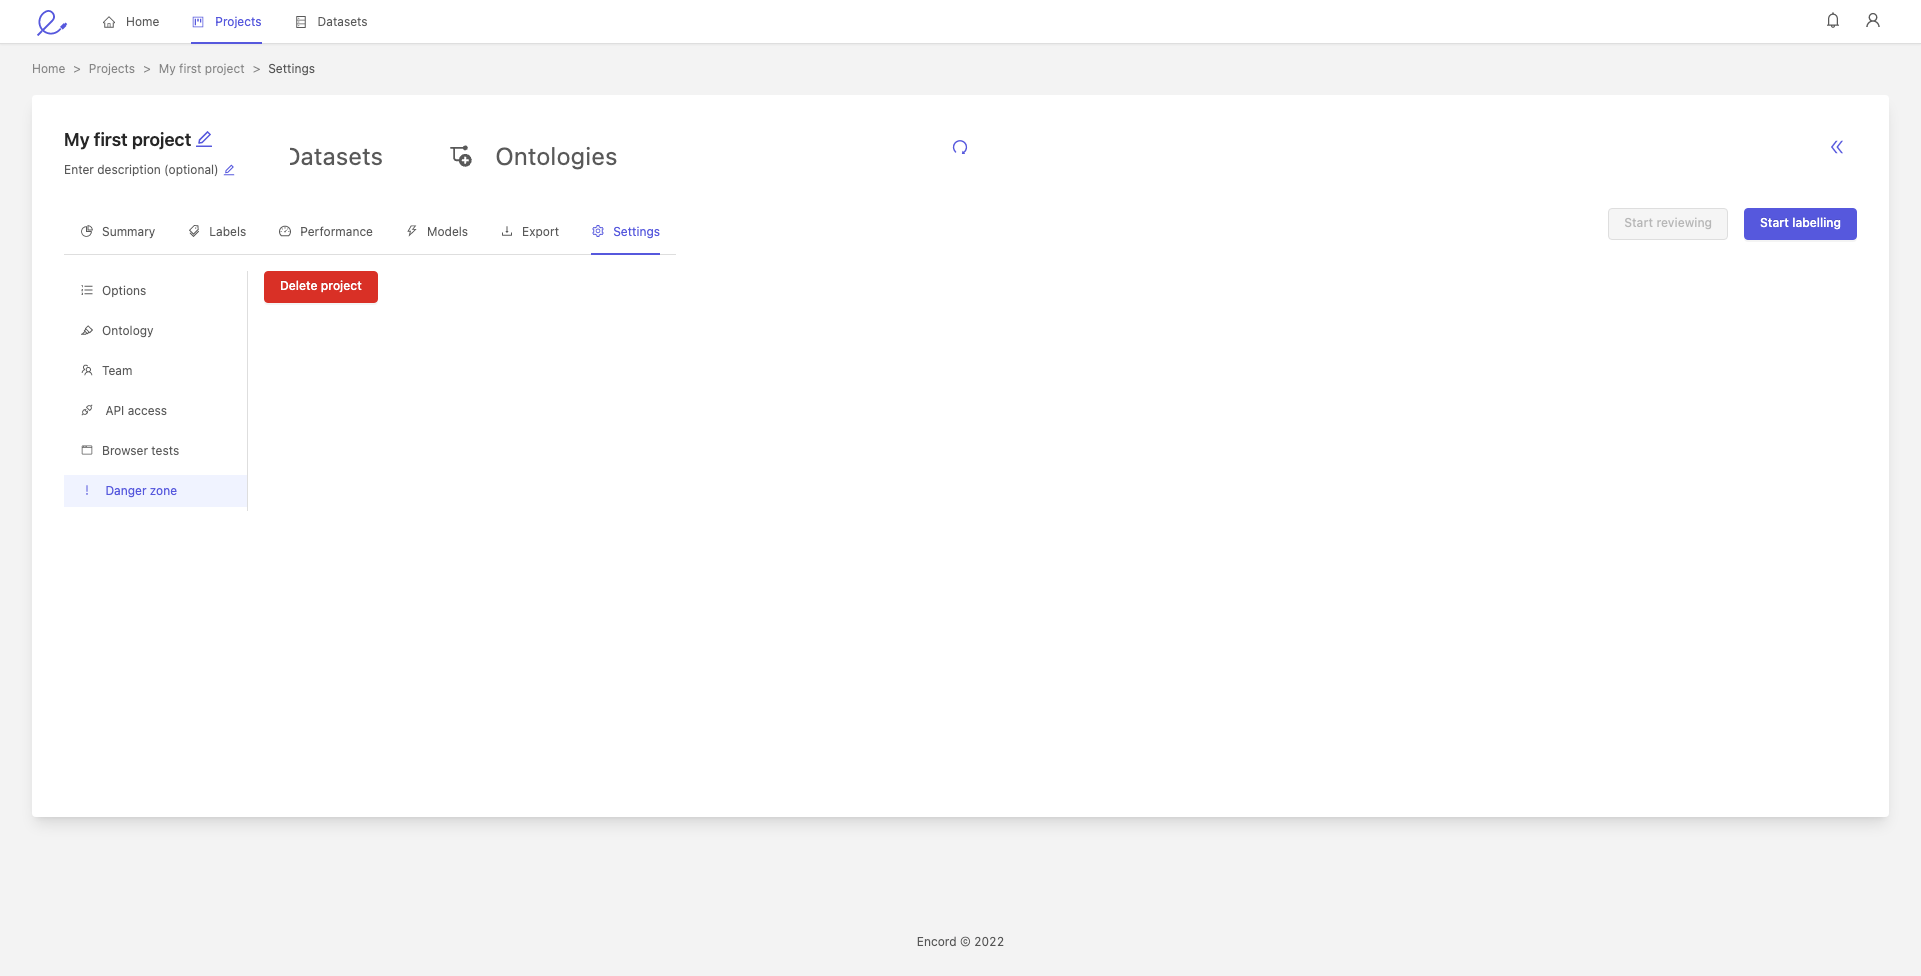
Deleting your project does not delete the datasets in the project, but will delete the project's labels and ontology.