Home dashboard
Your home dashboard is the first thing you see when you log in.
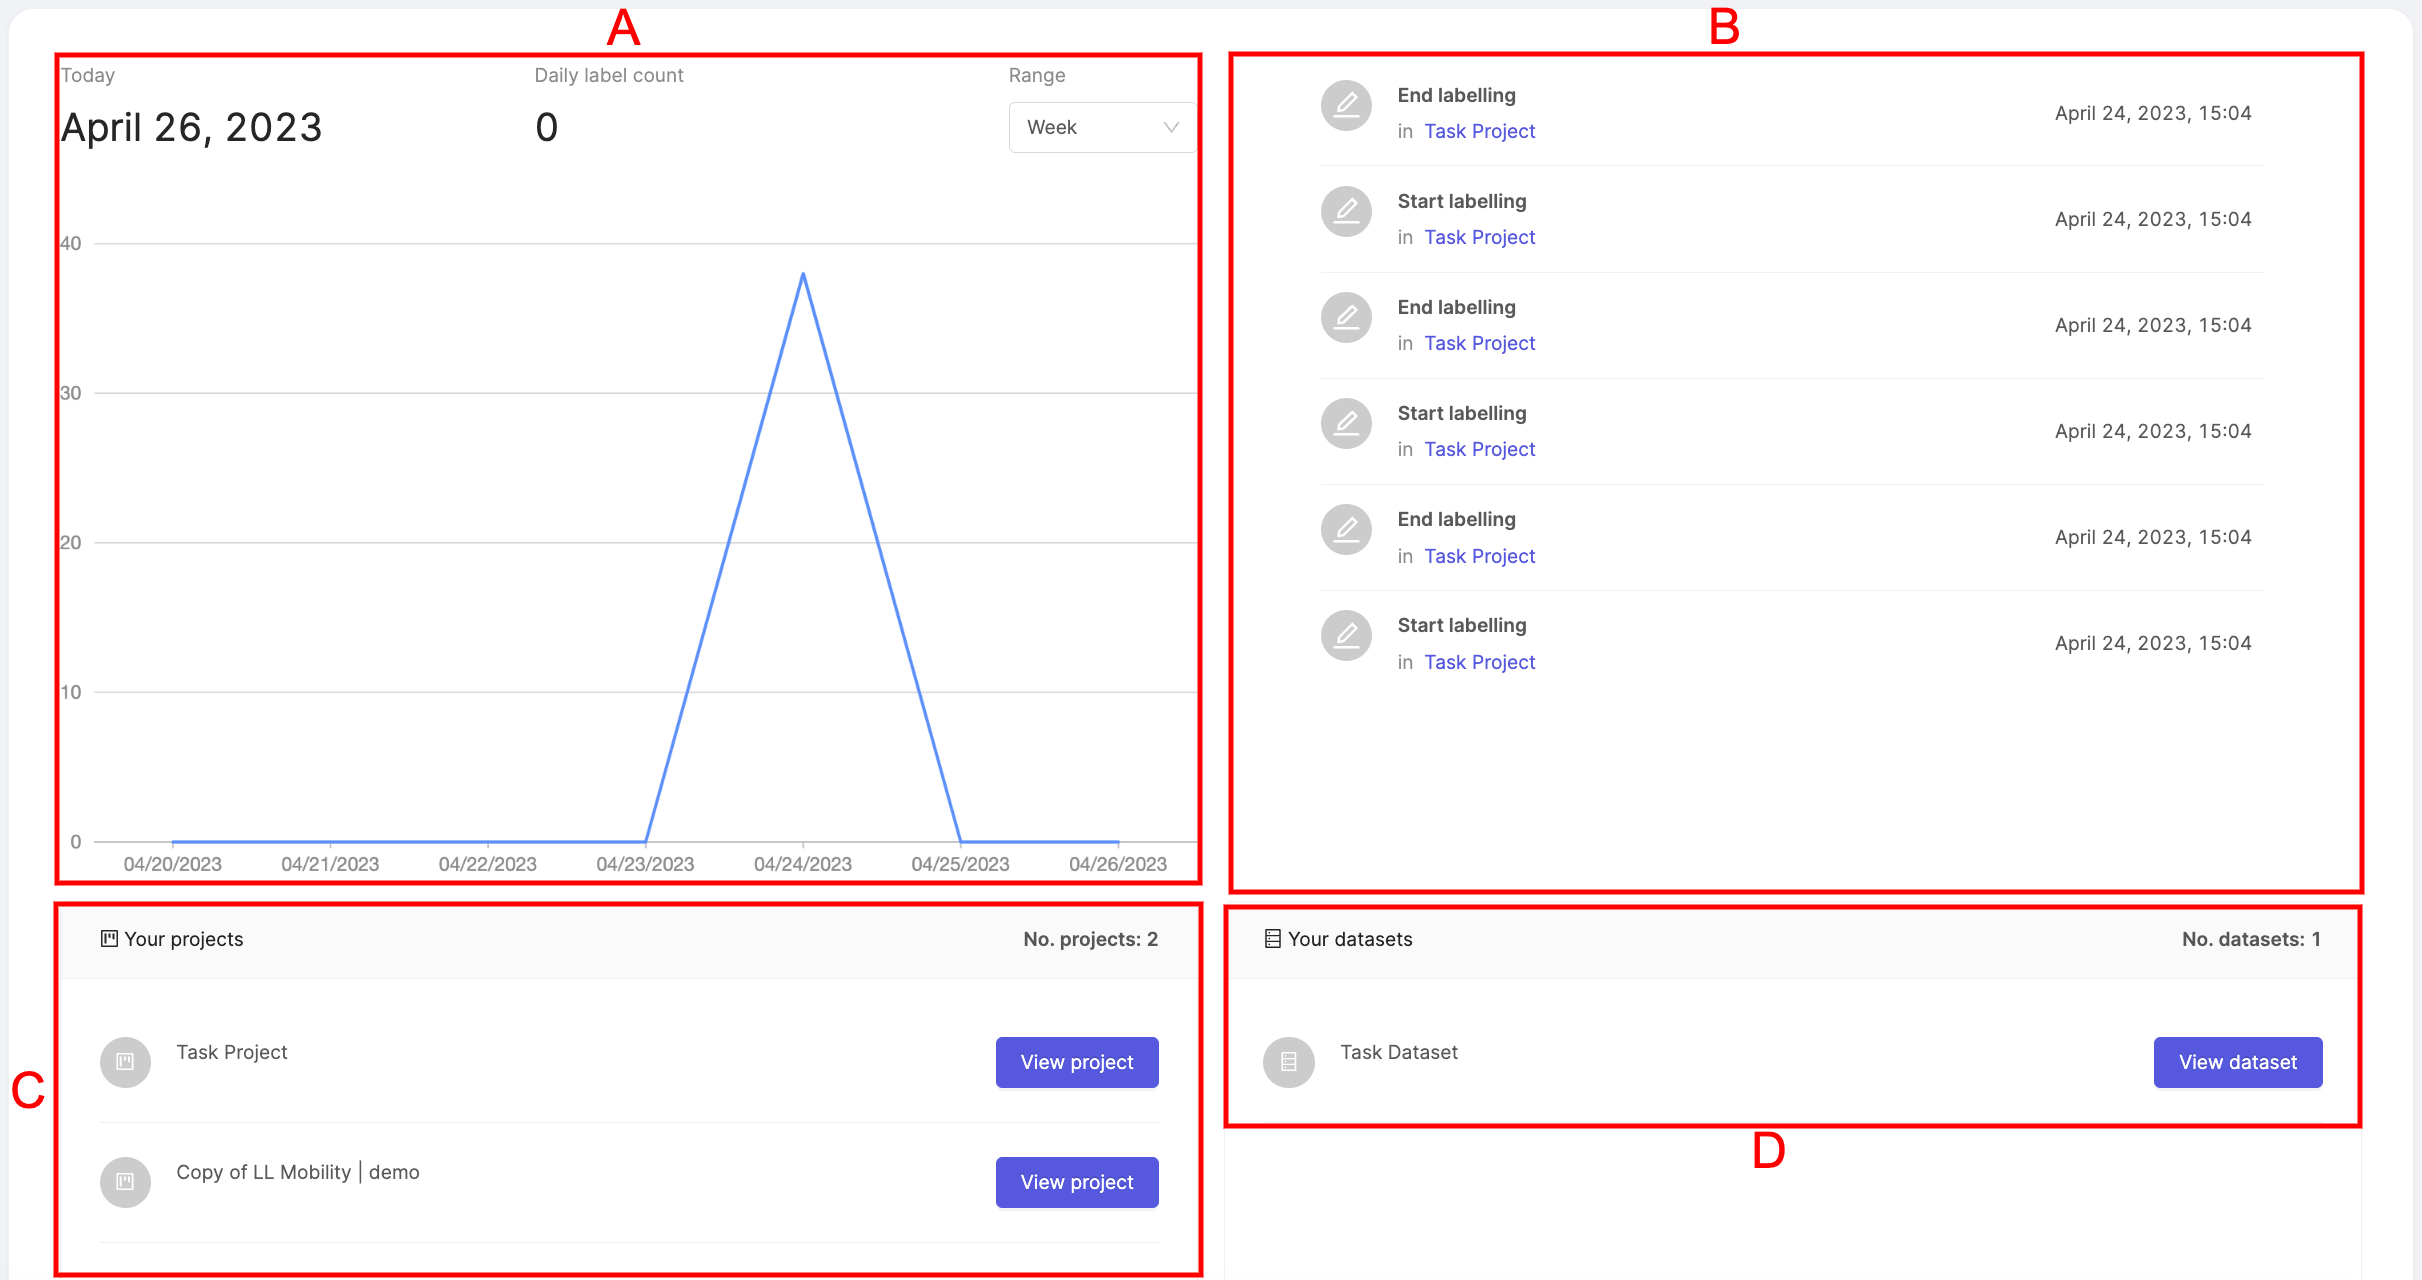
The home dashboard is split into four parts:
- A: The Activity graph plots daily label counts over a range that can be adjusted in the Range drop-down.
- B: The Activity log shows a timeline of the most recent labeling activity, with links to the relevant projects.
- C: Your projects shows a list of your projects. Clicking the View project button will take you to the Project dashboard for that project.
- D: Your datasets shows a list of your datasets. Clicking View dataset button will take you to the Dataset dashboard for that dataset.